Follow the Earnings
Key Observations

October was a puzzling month for many investors. How was the S&P 500® up around 8% when it seemed so many companies delivered weak earnings results? Some point to relief on the bond front. Perhaps we are getting closer to peak Fed Funds rate? The long end of the yield curve did rally a bit, and 10-year Treasury yields fell about 20 basis points from their mid-month peak. Still, that 10-year yield is roughly 40 bps higher than it was on the first of the month. Better answers may come by taking a closer look at those earnings.
With roughly two-thirds of S&P 500 companies reporting, companies have beaten estimates by just under 5% in aggregate. For those who are skeptical about earnings estimates, aggregate year-over-year growth stands at just over 4%. Those are not great numbers, but we’ve argued previously that equity markets were priced to miss expectations by potentially 10-15%, that could explain October’s rally. While equity prices have risen, earnings expectations have fallen, with 2022 estimates now calling for just 5-6% growth over trailing 12-month earnings.
Chart of the Month
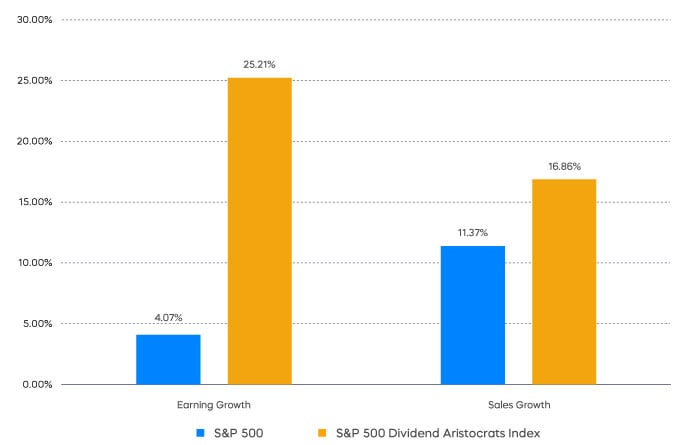
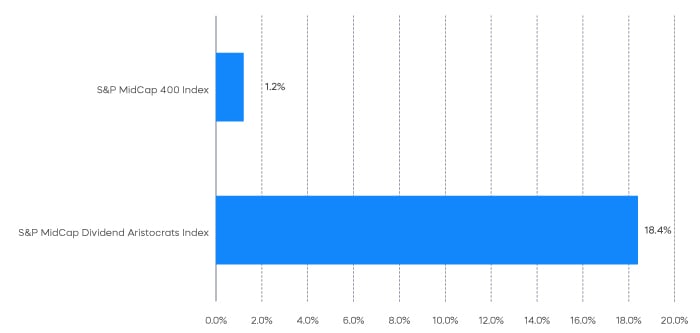
Companies with earnings growth and resilient margins in this environment may be on relatively firm ground. Case in point: The companies of the S&P 500® Dividend Aristocrats® Index. With over three-quarters of its constituents reporting, sales growth has come in just under 17%. Margins have also expanded, with just over 25% earnings growth.
Performance Recap
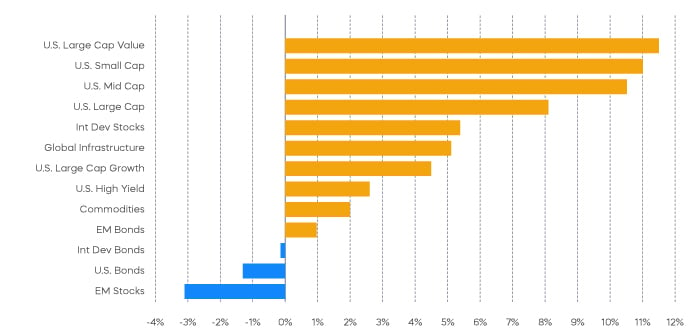
Most market segments were solidly green during October.
Economic Calendar
Here’s a list of upcoming key economic releases, which can serve as a guide to potential market indicators.

Equity Perspectives

Halloween season can bring surprises, but not usually like this. As we noted, the October stock market rally was indeed puzzling. Prices moved higher during the month, but so did volatility. Usually that’s the other way around. Mid-cap and small-cap stocks—chronic underperformers of late—outperformed large caps. Also, notable was the absence of growth stocks from the nascent rally. The S&P 500 Growth index was up only 4.5% for the month, significantly lagging the S&P 500. Notable mega-cap tech stocks like Meta, Alphabet and Microsoft delivered earnings results that disappointed investors, and saw significant declines in their share prices as a result. Major stock market benchmarks, however, still moved higher.
What does all that mean? Let’s take a closer look into third quarter earnings results for some insights.
Investors have watched third-quarter earnings season results almost as closely as they’ve been watching Fed commentary. Skepticism has grown about full-year 2022 S&P 500 earnings growth estimates—once as high as 10%. Indeed, those estimates have declined, though they remain positive at 6.1% according to FactSet. Third-quarter earnings growth has thus far been positive, but just barely. Twice as many companies have issued negative earnings guidance compared to positive outlooks.
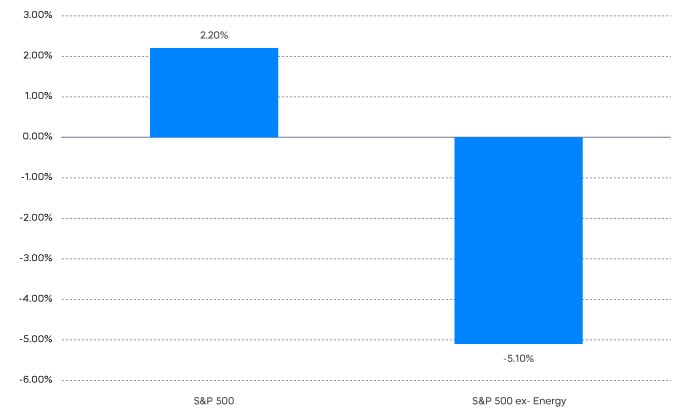
Perhaps most revealing is that earnings growth has been concentrated—with just four sectors delivering growth. One sector in particular, energy, has been doing most of the heavy lifting. In addition to energy leading the S&P from a performance perspective, it was also the market’s largest contributor to earnings for the third quarter, growing earnings by 134% over last year’s levels. Without energy, the S&P 500’s earnings growth would be negative.
Energy stocks are expected to continue to lead the market from an earnings contribution perspective for the next two quarters. After that, the high growth rates seen lately may become unsustainable, and energy could become a drag on the market’s future earnings growth. In the meantime, the market will need other sectors to provide leadership if further deterioration of earnings is to be avoided.
The Dividend Aristocrats® are large-cap, and mid-cap stocks that have grown their dividends consecutively for an extended number of years. Known for their ability to weather market turbulence, the Dividend Aristocrats have tended to outperform in down markets, and this year has been no exception. One reason for this is their tendency to provide more stable earnings results than broad-market indexes. As we noted earlier, the S&P 500 Dividend Aristocrats thus far have delivered earnings results that exceeded the S&P 500. This is true even if we exclude energy names Exxon and Chevron. We also note the S&P MidCap 400® Dividend Aristocrats®, which do not hold any energy names, have delivered stronger third-quarter earnings growth than the broad mid-cap market.
Fixed Income Commentary
Fixed income segments focused on corporate credit, and segments protected from rising Treasury yields like interest-rate hedged bonds, posted positive returns in October. Meanwhile, the US aggregate bond index, plain-vanilla Treasurys, mortgage-backed securities, and corporate bonds posted negative returns.
Fixed Income Returns—October 2022
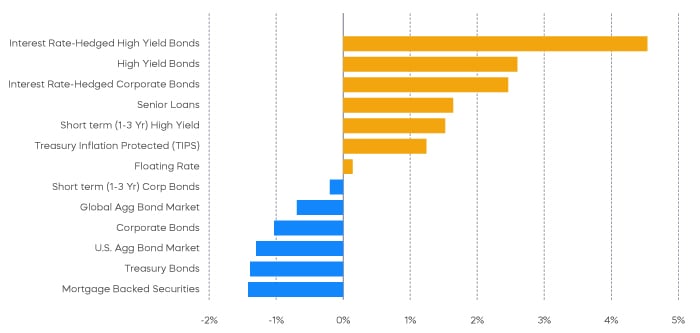
It’s a pattern that may persist. First, Treasury yields may continue to rise, pushing prices down for unprotected segments. One indication of continued upward pressure on yields is inflation expectations. Two-year breakeven inflation increased nearly one full percent in October. Credit-focused and interest-rate hedged segments may continue to outperform, however, potentially driven by corporate leverage.
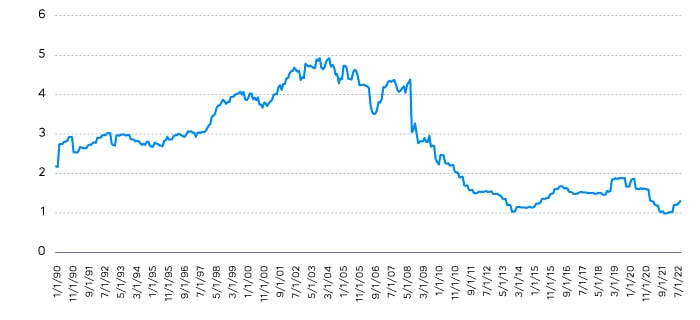
Corporate balance sheets are generally strong. Net Debt/EBITDA has been much lower than in past decades and credit spreads have widened this year. That could be a solid combination for corporate credit heading into 2023.
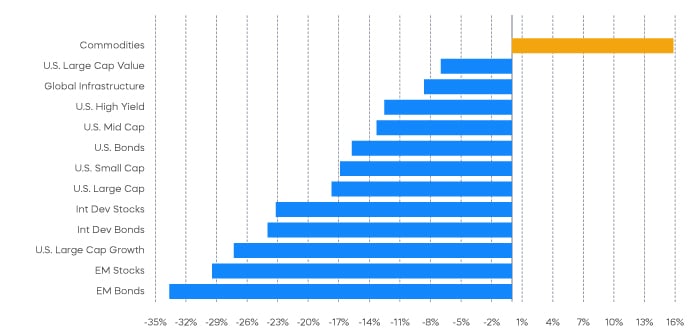
The different market segments represented in the performance recap charts use the following indexes: U.S. Large Cap: S&P 500 TR; U.S. Large Cap Growth: S&P 500 Growth TR; U.S. Large Cap Value: S&P 500 Value TR; U.S. Mid Cap: S&P Mid Cap TR; U.S. Small Cap: Russell 2000 TR; International Developed Stocks: MSCI Daily TR NET EAFE; Emerging Markets Stocks: MSCI Daily TR Net Emerging Markets; Global Infrastructure: Dow Jones Brookfield Global Infrastructure Composite; Commodities: Bloomberg Commodity TR; U.S. Bonds: Bloomberg U.S. Aggregate; U.S. High Yield: Bloomberg Corporate High Yield; International Developed Bonds: Bloomberg Global Agg ex-USD; Emerging Market Bonds: DBIQ Emerging Markets USD Liquid Balanced.
Breakeven inflation is calculated by subtracting the real yield of the inflation-linked maturity curve from the yield of the closest nominal Treasury maturity. The result is the implied inflation rate for the term of the stated maturity. The S&P 500 is a benchmark index published by Standard & Poor's (S&P) representing 500 companies with large-cap market capitalizations. The S&P 500 Dividend Aristocrats Index targets companies that are currently members of the S&P 500 that have increased dividend payments each year for at least 25 years. The S&P 500 Ex-Energy Index provides exposure to the companies of the S&P 500 with the exception of companies included in the energy sector. The S&P 500 Growth index serves as a proxy for growth companies included in the S&P 500, identifying them using three factors: sales growth, the ratio of earnings change to price, and momentum. The S&P MidCap 400 is a benchmark index published by Standard & Poor's (S&P) representing companies with mid-cap market capitalizations. The S&P MidCap 400 Dividend Aristocrats Index targets companies that are currently members of the S&P MidCap 400 that have increased dividend payments each year for at least 15 years. THESE ENTITIES AND THEIR AFFILIATES MAKE NO WARRANTIES AND BEAR NO LIABILITY WITH RESPECT TO PROSHARES.
This is not intended to be investment advice. Indexes are unmanaged, and one cannot invest directly in an index. Past performance does not guarantee future results.
Any forward-looking statements herein are based on expectations of ProShare Advisors LLC at this time. Whether or not actual results and developments will conform to ProShare Advisors LLC’s expectations and predictions, however, is subject to a number of risks and uncertainties, including general economic, market and business conditions; changes in laws or regulations or other actions made by governmental authorities or regulatory bodies; and other world economic and political developments. ProShare Advisors LLC undertakes no duty to update or revise any forward-looking statements, whether as a result of new information, future events or otherwise.
Investing is currently subject to additional risks and uncertainties related to COVID-19, including general economic, market and business conditions; changes in laws or regulations or other actions made by governmental authorities or regulatory bodies; and world economic and political developments.
Investing involves risk, including the possible loss of principal. This information is not meant to be investment advice.
The “S&P 500®" and “S&P MidCap 400® Dividend Aristocrats Index” are products of S&P Dow Jones Indices LLC and its affiliates. "S&P®" is a registered trademark of Standard & Poor’s Financial Services LLC (“S&P”), and “Dow Jones®" is a registered trademark of Dow Jones Trademark Holdings LLC (“Dow Jones”) and they have been licensed for use by S&P Dow Jones Indices LLC and its affiliates. The "Russell 2000 Index" and "Russell®" are trademarks of Russell Investment Group ("Russell") and have been licensed for use by ProShares. ProShares based on these indexes are not sponsored, endorsed, sold or promoted by these entities or their affiliates, and they make no representation regarding the advisability of investing in ProShares. THESE ENTITIES AND THEIR AFFILIATES MAKE NO WARRANTIES AND BEAR NO LIABILITY WITH RESPECT TO PROSHARES.