Key Observations

Another bank failure… but the S&P 500 still managed to increase over 1.5% in April. That doesn’t seem like much of a crisis. More importantly, credit markets don’t seem to think there’s a banking crisis either.
Chart of the Month
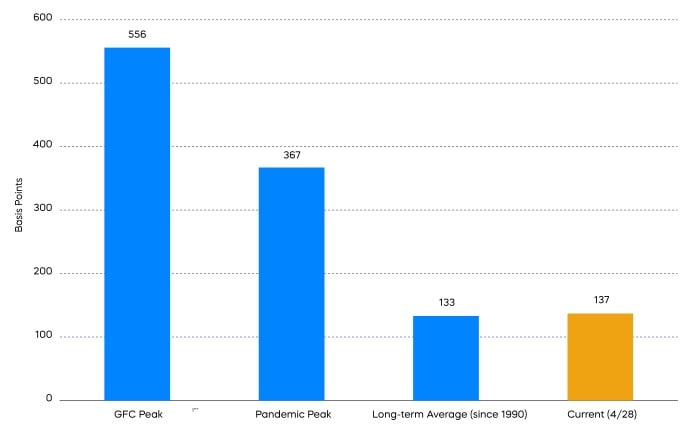
Current and Historical Investment-Grade Credit Spreads
Source: Bloomberg. Data from 12/31/89–4/30/23.
The preponderance of views on the recent banking events is that a string of bank failures probably isn’t in-the-cards, though bank profitability may be challenged. And with investment-grade credit spreads sitting very near their long-term average, the credit markets would seem to agree.
What about stagflation—or at least stagflation-lite? First-quarter GDP came in at 1.1%. That’s notably below expectations. But here’s what else happened of late: one-year breakeven inflation came down from a high of 3.66% in early March, to 2.11% at the end of April (Source: Bloomberg). That’s not five or 10-year breakeven inflation. That’s the one-year inflation reading. While economic growth may not be robust, markets are at least expecting inflation to be significantly reduced. Thus, perhaps an expectation for stagnation, but not stagflation.
By process of elimination, a soft landing appears to be what we’re left with. The difference may be predominantly semantic, however. The trajectory of the equity markets might not be that much different if GDP growth is marginally negative and inflation modestly above the Federal Reserve’s 2% target (stagflation-lite), compared to marginally positive GDP growth and inflation right around 2% (soft-landing). It’s a tepid outlook, but for those of us who’ve seen worse, I suppose we’ll take it.
Performance Recap
Still a lot of positive results for an almost banking crisis.
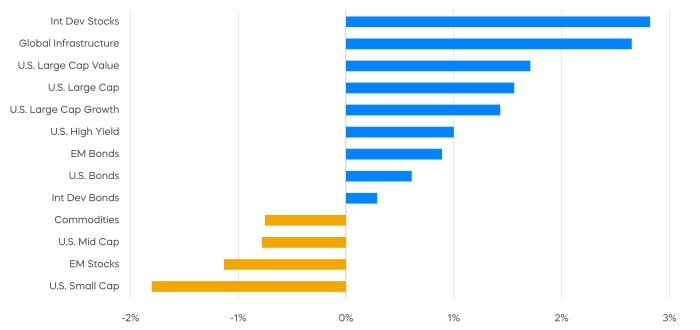
Asset Class Returns—April 2023
Asset Class Returns—Year-to-Date 2023
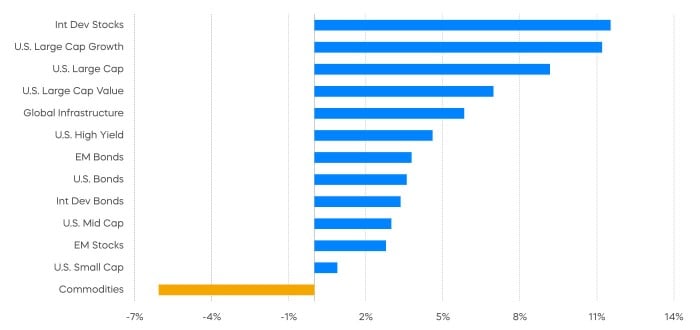
Source: Bloomberg. April returns 4/1/23‒4/30/23; year-to-date returns 1/1/23‒4/30/23. Index returns are for illustrative purposes only and do not reflect any management fees, transaction costs or expenses. Indexes are unmanaged, and one cannot invest directly in an index. Past performance does not guarantee future results.
Economic Calendar
Here’s a list of key and upcoming economic releases, which can serve as a guide to potential market indicators.
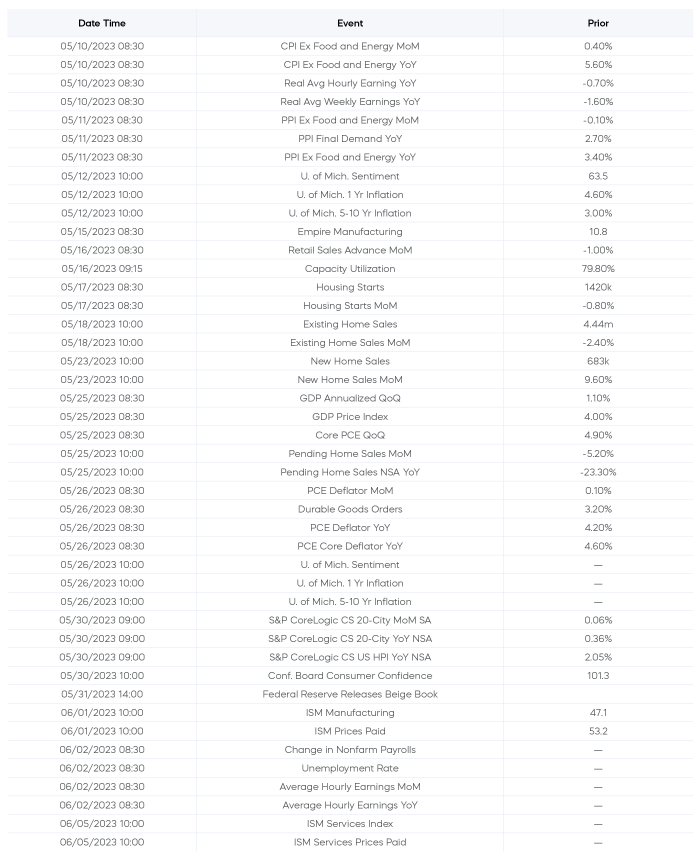
Source: Bloomberg, as of 5/2/23.
Equity Perspectives

The Secret Sauce
Berkshire Hathaway’s annual letter to shareholders is considered a must read by investors looking for nuggets of Warren Buffett’s wisdom. Buffett has been managing Berkshire for over 58 years, and this year’s letter gave a peek behind the curtain at the factors that have helped produce those legendary returns.
Buffett pointed out that it takes just a few winners to compound wealth in a portfolio over time. One example he gave was Berkshire’s Coca-Cola (KO) investment, which was completed in 1994 for a total cost of $1.3 billion. According to Berkshire Hathaway’s 2022 annual report, Berkshire earned $75 million in dividends from Coke in 1994, and over time, those dividends grew every year “just as certain as birthdays.” By 2022, those dividends grew almost 10x, to a sum of $704 million—an amount Buffett calls “far from spectacular.”
The point he was making is that the yearly growth in dividends brought important gains in the stock price. In other words, a focus on steady and consistent dividend growth can often lead to superior total returns. By the end of 2022, Berkshire’s total investment in Coca-Cola was worth $25 billion. From the year Berkshire first started buying KO in 1987, through 2022, KO returned over 12% annualized, and outperformed the S&P 500 (Source: Berkshire Hathaway and Morningstar).
Buffett’s timeless lesson for investors: “The weeds wither away in significance as the flowers bloom. Over time, it takes just a few winners to work wonders.”
The S&P 500 Dividend Aristocrats Have Delivered All Weather Performance
We use this month’s commentary to offer our own timeless piece of investing wisdom: tune out the noise and focus on what matters over the long term.
With the anxiety of the most recent bank failures and what a potential recession may look like, we remind you that companies that have consistently grown their dividends over time have produced strong long-term performance, no matter the market conditions.
Coca Cola has been growing its dividend for over 50 years and is one of the longest tenured members of S&P 500 Dividend Aristocrats Index, a select group of 66 names that have been growing their dividends for at least 25 consecutive years. In fact, over half of the index companies have grown their dividends for more than 40 years, and some members surpass 60 years of consistent dividend growth. Since the index’s inception in 2005, this elite group of companies has survived the market’s ups and downs—including two previous recessions—and still continued growing their dividends. They have also delivered better returns with lower volatility than the S&P 500, growth stocks, value stocks, and high dividend yield stocks. A winning strategy indeed.
Select Returns and Volatility Over Time
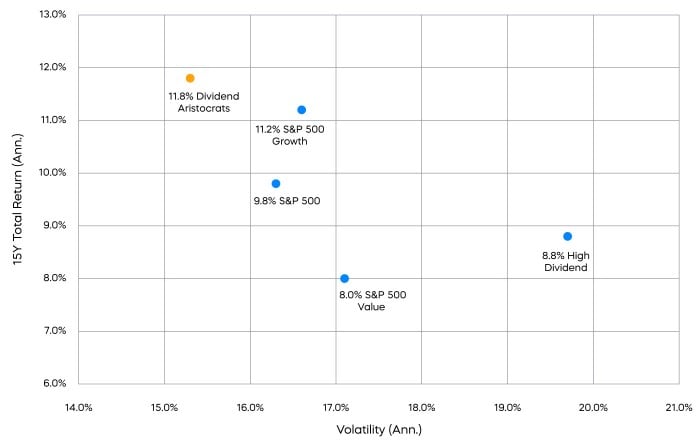
Source: Standard & Poor’s. Data from 5/1/08–4/30/23. Indexes used are the S&P 500, S&P 500 Dividend Aristocrast Index, S&P 500 Growth Index, S&P 500 Value Index and S&P 500 High Dividend Index.
Fixed Income Perspectives

Bonds have continued to deliver strong total returns year-to-date. While spreads are sitting at similar levels to the start of the year, the key driver of this performance so far has been an across the curve decrease in interest rates.
Fixed Income Returns—April 2023
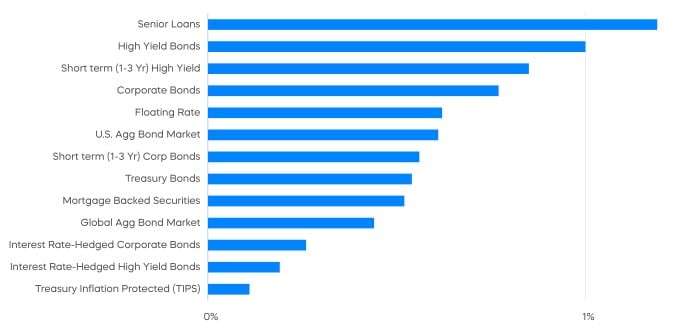
Source: Bloomberg. Data as of 4/30/23.
The Fed Fund futures market may offer a clue for falling rates, as it is increasingly pricing in not only a Fed pause, but rate cuts in the second half of 2023. Will the Fed soon cut rates and lift bond prices? That might be hard to justify given how resilient the labor market has been.
Month-Over-Month Change in Non-Farm Payrolls
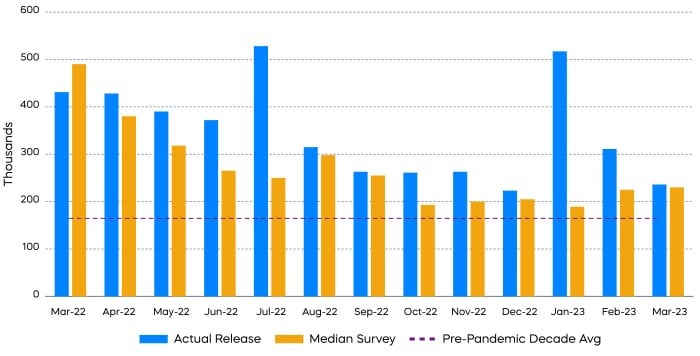
Source: Bloomberg. Data from 4/1/22–4/7/23.
The monthly change in non-farm payrolls has exceeded expectations twelve months in a row, as of March. While the trend is pointing to slower increases, it remains above the pre-pandemic average. In other words, unless we start to see meaningful deterioration in the labor market soon, the Fed may not have a good case to begin cutting rates so quickly.
It’s also worth noting just how tight monetary conditions are—particularly in light of recent banking sector developments. It’s not just the increases in the Fed Funds target rate, which at 4.75% is the largest magnitude going back to the 1980s. It’s also the shrinking of the money supply for the first time since the data series began in 1960. Here’s where the banking challenges enter. The Fed shrinking its balance sheet through quantitative tightening is one ingredient, but rising rates may also mute the demand for credit and reduce bank deposits.
Year-Over-Year Changes in Money Supply
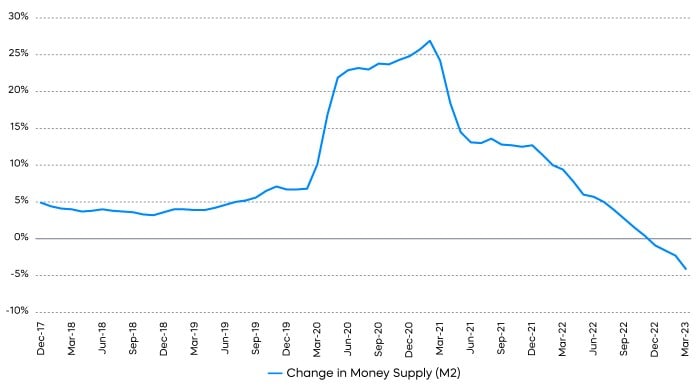
Source: Bloomberg. Data as of 4/30/23.
There’s a lag effect here. The shrinking money supply may take a bit longer to do its work in bringing down inflation. But with breakeven inflation now near 2% for one year and beyond, the bond market has indicated its seeming confidence that the job will get done.
Sources for data and statistics: Bloomberg, FactSet, Morningstar, and ProShares.
The different market segments represented in the performance recap charts use the following indexes: U.S. Large Cap: S&P 500 TR; U.S. Large Cap Growth: S&P 500 Growth TR; U.S. Large Cap Value: S&P 500 Value TR; U.S. Mid Cap: S&P Mid Cap TR; U.S. Small Cap: Russell 2000 TR; International Developed Stocks: MSCI Daily TR NET EAFE; Emerging Markets Stocks: MSCI Daily TR Net Emerging Markets; Global Infrastructure: Dow Jones Brookfield Global Infrastructure Composite; Commodities: Bloomberg Commodity TR; U.S. Bonds: Bloomberg U.S. Aggregate; U.S. High Yield: Bloomberg Corporate High Yield; International Developed Bonds: Bloomberg Global Agg ex-USD; Emerging Market Bonds: DBIQ Emerging Markets USD Liquid Balanced.
The S&P 500 is a benchmark index published by Standard & Poor's (S&P) representing 500 companies with large-cap market capitalizations. The S&P 500 Dividend Aristocrats Index targets companies that are currently members of the S&P 500 that have increased dividend payments each year for at least 25 years. The S&P 500 Growth Index represents the fastest-growing companies in the S&P 500. The S&P 500 Value Index consists of stocks within the S&P 500 that exhibit strong value investment characteristics. The S&P High Dividend Index is designed to measure the performance of 80 high-yield companies within the S&P 500. THESE ENTITIES AND THEIR AFFILIATES MAKE NO WARRANTIES AND BEAR NO LIABILITY WITH RESPECT TO PROSHARES.
This is not intended to be investment advice. Indexes are unmanaged, and one cannot invest directly in an index. Past performance does not guarantee future results.
Any forward-looking statements herein are based on expectations of ProShare Advisors LLC at this time. Whether or not actual results and developments will conform to ProShare Advisors LLC’s expectations and predictions, however, is subject to a number of risks and uncertainties, including general economic, market and business conditions; changes in laws or regulations or other actions made by governmental authorities or regulatory bodies; and other world economic and political developments. ProShare Advisors LLC undertakes no duty to update or revise any forward-looking statements, whether as a result of new information, future events or otherwise.
Investing is currently subject to additional risks and uncertainties related to COVID-19, including general economic, market and business conditions; changes in laws or regulations or other actions made by governmental authorities or regulatory bodies; and world economic and political developments.
Investing involves risk, including the possible loss of principal. This information is not meant to be investment advice.
The “S&P 500®” and “S&P 500® Dividend Aristocrats® Index” are products of S&P Dow Jones Indices LLC and its affiliates and have been licensed for use by ProShare Advisors LLC. "S&P®" is a registered trademark of Standard & Poor’s Financial Services LLC (“S&P”), and “Dow Jones®" is a registered trademark of Dow Jones Trademark Holdings LLC (“Dow Jones”) and they have been licensed for use by S&P Dow Jones Indices LLC and its affiliates. ProShares ETFs based on these indexes are not sponsored, endorsed, sold or promoted by these entities or their affiliates, and they make no representation regarding the advisability of investing in ProShares ETFs. THESE ENTITIES AND THEIR AFFILIATES MAKE NO WARRANTIES AND BEAR NO LIABILITY WITH RESPECT TO PROSHARES.