Key Observations

Q4 earnings season has just about wrapped up, and it was a decent one: S&P 500 earnings rose 7.8% year-on-year. It was an even better one for the technology sector, which was up 23.5% in the fourth quarter. This performance is reinforcing a perspective that tech may not be heading for a fall this time around. Weren’t tech stocks in the late '90s about things like sock puppets and eyeballs, and not about making money? Tech stocks today generally make lots of money—so, everything’s fine? That’s not necessarily the case. Let’s take a look.
Chart of the Month
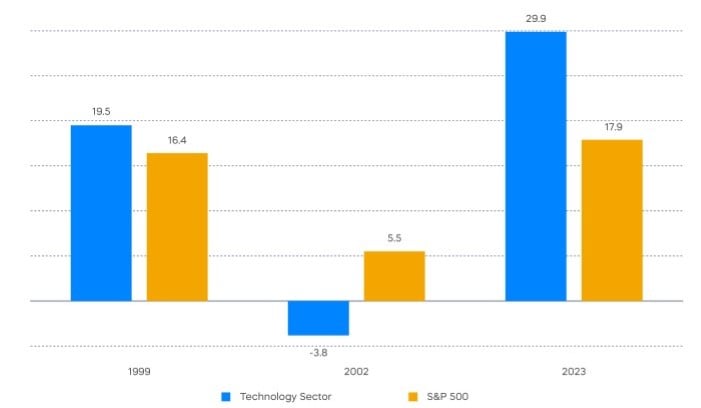
There were plenty of tech stocks that were making money in 1999: Microsoft, Cisco, Intel, Nokia, Oracle, HP, Dell, etc. And collectively, they exhibited signs of quality. The return on equity of the S&P 500 tech sector was generally higher than the broad S&P 500. By 2002, however, that relationship had reversed, with the tech sector’s return on equity heading into negative territory. The “bubble” in tech stocks turned out to be not just a stock price bubble, but also a “bubble” in fundamental performance.
Can it be different this time? It can be, but nobody knows for certain. The current gap between S&P 500 technology sector’s return on equity and that of the S&P 500 is even wider than it was in 1999. And perhaps the economy will avoid the recession that afflicted the United States in 2001. Still, it doesn’t take a particularly deep dive into the so-called “tech wreck” to see that complacency in the face of the tech sector’s profitability is not without risk. Moreover, the identification of quality companies that are built to last may require looking beyond last quarter’s earnings.
Performance Recap
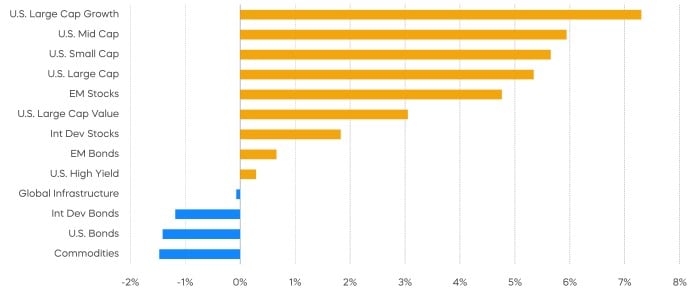
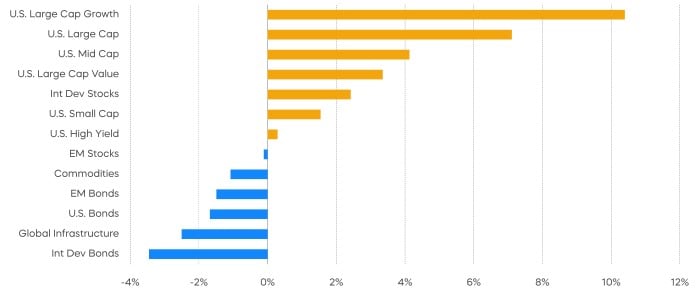
Equity markets continued to rally, broadening out to mid-cap and small-cap stocks, as breadth improved in the U.S. market. Emerging market stocks recovered from losses in January, as the Chinese stock market staged a rebound around the holiday closure. Bonds and commodities lagged as Treasury yields increased.
Economic Calendar
Here’s a list of key and upcoming economic releases, which can serve as a guide to potential market indicators.

Equity Perspectives

The bursting of the dot.com bubble in March 2000 marked the beginning of the “lost decade” for the S&P 500, during which the venerable index lost over 9% during the first decade of the century (Source: Morningstar). Then, as now, a small cohort of technology-oriented growth stocks contributed a disproportionate amount of the market’s returns, fueled by euphoria over a potentially transformational technology.
What lessons did the tech wreck teach us? We offer two possible answers:
- First, extreme levels of market concentration typically don’t end well, and today’s levels present a risk for investors deploying market-cap weighted strategies.
- Second, an equal-weight approach may not be enough.
High-quality strategies that have been underperforming the Artificial-Intelligence driven rally, but are still delivering sustainable earnings strength, may be positioned to outperform.
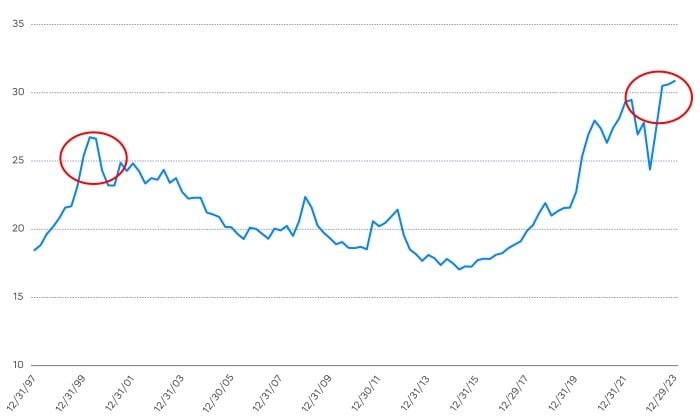
The S&P 500 has reached historical levels of concentration and therefore presents potentially underappreciated risks. The last time we had a similar dynamic, it didn’t end well. According to Bloomberg, by March of 2000, the weight of the top 10 names in the S&P 500 had reached 27%—at that point, a record high. After the bubble burst, their share steadily declined to a more historical average of approximately 20%. By December 2023, after another impressive technology-led rally, the top 10 names in the S&P 500 represented 31% of the market—a new all-time high.
An equal-weighted approach to portfolio construction may seem like an obvious pivot to potentially address concentration risks. But will it be enough?
Our view is that earnings will be a key driver for the equity markets in 2024. While expectations are optimistic for 2024, the S&P 500 is coming off of a flat earnings performance in 2023. The S&P 500 Dividend Aristocrats, on the other hand, were a reliable source for resilient earnings growth, as we show in the chart below. Given their relatively attractive valuations vs. the S&P 500, their potential ability to deliver more consistent levels of earnings growth, and their equal-weighted construction, the Dividend Aristocrats may be an option in a heavily concentrated market.
Dividend Aristocrats Delivered Greater Earnings Growth vs. the S&P 500 in 2023
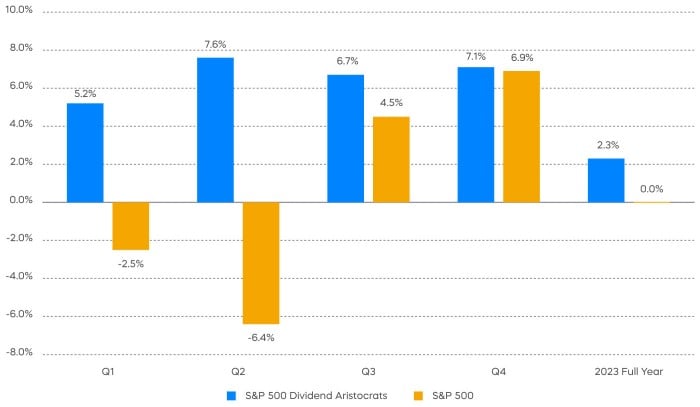
Source: Bloomberg, data as of 2/22/2024. Index returns are for illustrative purposes only and do not reflect any management fees, transaction costs or expenses. Indexes are unmanaged, and one cannot invest directly in an index. Past performance does not guarantee future results.
Fixed Income Perspectives

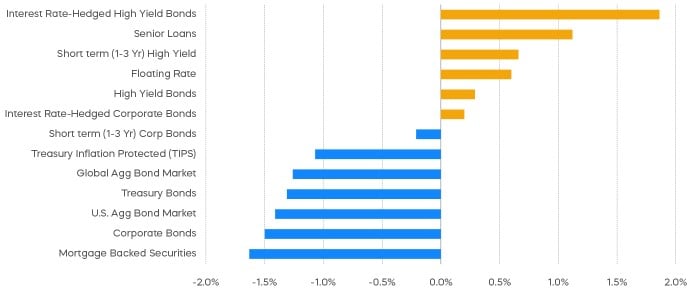
Treasury yields increased across the curve while credit spreads tightened amid broadly positive risk sentiments. Lower duration and lower credit quality outperformed during the month. Mortgage-backed securities were the worst-performing fixed income asset class due to yield curve inversion.
The higher-than-expected Nonfarm Payrolls and Consumer Price Index print for the month of January prompted a rapid change in sentiments around interest rate cuts. The Fed Funds futures market started the year anticipating more than six rate reductions. By the end of February, the market had dialed that back to just over three rate cuts, aligning with the Federal Reserve’s most recent median projection. And some are now suggesting the next policy move could be a rate hike instead, such as former U.S. Treasury Secretary Larry Summers, who sees a “meaningful chance” of a hike happening.[1]

While we still think inflation is well on its path toward target this year, recent economic data gives the Federal Reserve room to be patient in holding rates steady, which probably takes a March rate cut off the table. Problematic for the Federal Reserve, however, is that the equity rally continues to broaden, offsetting any tightening of financial conditions from higher interest rates.
The stock market appears to have taken the Federal Reserve’s current stance in stride. It seems to be looking ahead to future easing, which could bring positive momentum to the economy. However, if inflation recedes without a significant slowdown, investors shouldn’t expect the policy easing to be very accommodative.
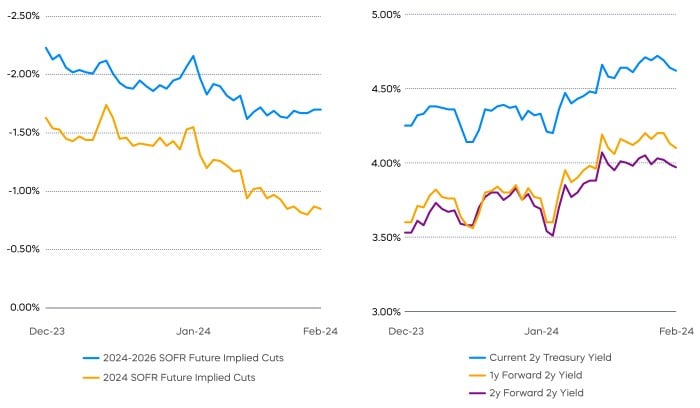
The bond market seems to recognize that a delay in timing and a lower magnitude of rate reductions are effectively two sides of the same coin. As the market expects fewer rate cuts for 2024, expectations fell for the three-year period as well. Meanwhile, the 1-year and 2-year forward yields have kept up with the increase in the current 2-year yield.
In the January Federal Open Market Committee press conference, Chair Powell has described the Federal Reserve as “in a risk-management mode.” Delaying rate cuts may lower the risk of reigniting inflation, but policy rates may need to be reduced eventually as inflation falls and real yields become too elevated. Alternatively, the Federal Reserve could proceed with rate cuts but keep policy rates higher for longer. In past rate cut cycles, policy rates have usually been reduced significantly, so investors may expect the same to play out this time around. Therefore, the potentially better risk management decision could be communicating that rates would be reduced more deliberately in a soft-landing economy.
Sources for data and statistics: Bloomberg, FactSet, Morningstar, and ProShares.
The different market segments represented in the performance recap charts use the following indexes: U.S. Large Cap: S&P 500 TR; U.S. Large Cap Growth: S&P 500 Growth TR; U.S. Large Cap Value: S&P 500 Value TR; U.S. Mid Cap: S&P Mid Cap TR; U.S. Small Cap: Russell 2000 TR; International Developed Stocks: MSCI Daily TR NET EAFE; Emerging Markets Stocks: MSCI Daily TR Net Emerging Markets; Global Infrastructure: Dow Jones Brookfield Global Infrastructure Composite; Commodities: Bloomberg Commodity TR; U.S. Bonds: Bloomberg U.S. Aggregate; U.S. High Yield: Bloomberg Corporate High Yield; International Developed Bonds: Bloomberg Global Agg ex-USD; Emerging Market Bonds: DBIQ Emerging Markets USD Liquid Balanced.
The different market segments represented in the fixed income returns charts use the following indexes: Global Agg Bond Market: Bloomberg Global-Aggregate Total Return Index Value Unhedged USD; Mortgage Backed Securities: Bloomberg U.S. MBS Index Total Return Value Unhedged USD; Treasury Bonds: Bloomberg U.S. Treasury Total Return Unhedged USD; U.S. Agg Bond Market: Bloomberg U.S. Agg Total Return Value Unhedged USD; Corporate Bonds: Bloomberg US Corporate Total Return Value Unhedged USD; High Yield Bonds: Bloomberg U.S. Corporate High Yield Total Return Index Value Unhedged USD; Interest Rate-Hedged High Yield Bonds: FTSE High Yield (Treasury Rate-Hedged) Index; Treasury Inflation Protected (TIPS): Bloomberg U.S. Treasury Inflation Notes TR Index Value Unhedged USD; Short term (1-3 Yr) High Yield: Bloomberg U.S. Corporate 0-3 Year Total Return Index Value Unhedged USD; Senior Loans: Morningstar LSTA U.S. Leveraged Loan 100 Index; Short term (1-3 Yr) Corp Bonds: Bloomberg U.S. Corporate 1-3 Yr Total Return Index Value Unhedged USD; Floating Rate: Bloomberg U.S. FRN < 5 yrs Total Return Index Value Unhedged USD; Interest Rate-Hedged Corporate Bonds: FTSE Corporate Investment Grade (Treasury Rate-Hedged) Index.
The S&P 500 is a benchmark index published by Standard & Poor's (S&P) representing 500 companies with large-cap market capitalizations. The S&P 500 Dividend Aristocrats Index targets companies that are currently members of the S&P 500 that have increased dividend payments each year for at least 25 years. S&P 500 Information Technology Sector Index comprises those companies included in the S&P 500 that are classified as members of the GICS® information technology sector. THESE ENTITIES AND THEIR AFFILIATES MAKE NO WARRANTIES AND BEAR NO LIABILITY WITH RESPECT TO PROSHARES.
This is not intended to be investment advice. Indexes are unmanaged, and one cannot invest directly in an index. Past performance does not guarantee future results.
Any forward-looking statements herein are based on expectations of ProShare Advisors LLC at this time. Whether or not actual results and developments will conform to ProShare Advisors LLC’s expectations and predictions, however, is subject to a number of risks and uncertainties, including general economic, market and business conditions; changes in laws or regulations or other actions made by governmental authorities or regulatory bodies; and other world economic and political developments. ProShare Advisors LLC undertakes no duty to update or revise any forward-looking statements, whether as a result of new information, future events or otherwise.
Investing involves risk, including the possible loss of principal. This information is not meant to be investment advice.
The “S&P 500®,” “S&P 500® Dividend Aristocrats® Index” and “S&P 500 Daily Covered Call Index” are products of S&P Dow Jones Indices LLC and its affiliates and have been licensed for use by ProShare Advisors LLC. "S&P®" is a registered trademark of Standard & Poor’s Financial Services LLC (“S&P”), and “Dow Jones®" is a registered trademark of Dow Jones Trademark Holdings LLC (“Dow Jones”) and they have been licensed for use by S&P Dow Jones Indices LLC and its affiliates. ProShares ETFs based on these indexes are not sponsored, endorsed, sold or promoted by these entities or their affiliates, and they make no representation regarding the advisability of investing in ProShares ETFs. THESE ENTITIES AND THEIR AFFILIATES MAKE NO WARRANTIES AND BEAR NO LIABILITY WITH RESPECT TO PROSHARES.