Key Observations

There’s little denying that expectations for Fed rate cuts are getting pushed back. At the beginning of 2024, the Fed Funds rate implied by Fed Funds Futures for the end of January 2025 was 3.59%. As of April 1, that implied rate rose to 4.46%. One might expect that this hawkish path would take a toll on the equity market, but the S&P 500 was up over 10.5% for the first quarter of the year. Why might that be?
Chart of the Month
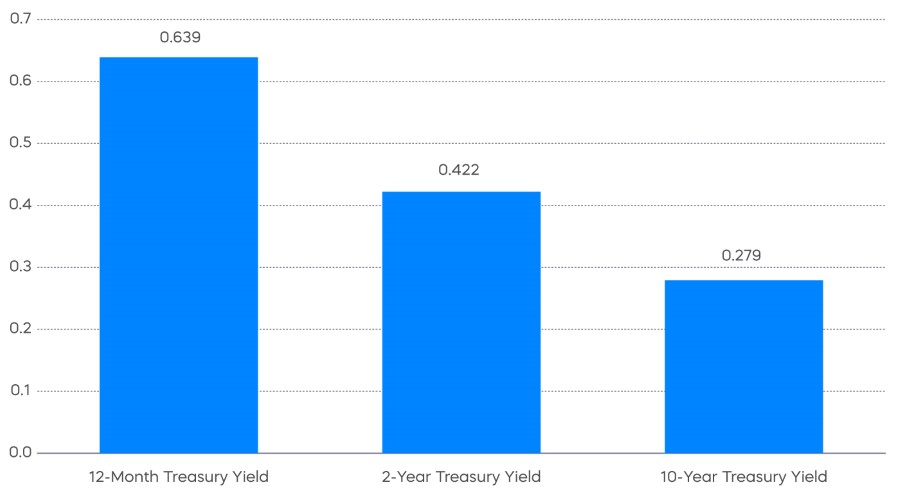
Part of the answer may be that expectations for Fed cuts are merely delayed. The Bloomberg consensus forecast for Q3 2025 Fed Funds rate stands at 3.7%. Perhaps a more thorough answer lies in a return to a “normal” bond market.
While Quantitative Easing may have made it appear that longer term interest rates were linked to the Fed Funds rates, as the chart above shows, longer-term rates have, in fact, exhibited little correlation to Fed Funds rates over time (Source: Bloomberg). And it’s longer-term interest rates that tend to drive stock prices. While it is true that 10-Year Treasury yields have risen since the beginning of the year (around 30 bps), that modest an increase isn’t likely to have much impact on stocks.
Forecasters seem on board with the independence of longer-term interest rates from the Fed Funds rate. Over the next 18 months the market expects a nearly 200 bps decline in the Fed Funds rate, but a much smaller decline in the 10-Year Treasury Yield.
The “liberation” of the 10-Year Treasury Yield from the Fed Funds rate may have arguably been to the benefit of the equity markets so far this year. It seems to have allowed equities to “shrug off” an expected deferment of Fed rate cuts. However, it should also be a cautionary note for those expecting a boost to equity markets when the Fed eventually does start to cut rates. If the 10-Year Treasury remains range bound—as suggested by consensus forecasts—that boost might not materialize.
Our intent is not to put forth a particularly bearish view of equity markets. The probability of a soft/no landing with decent earnings growth is still a solid foundation for equities, even without an extra push from falling longer-term interest rates. But all of this does provide important information for equity positioning. Loading up on interest rate sensitive areas of the equity market—deep value, high dividend yield, utilities, etc.—may not be the best play. Fortunately, there are plenty of quality and interest rate resilient areas of the stock market that have been left behind of late that may represent better opportunities.
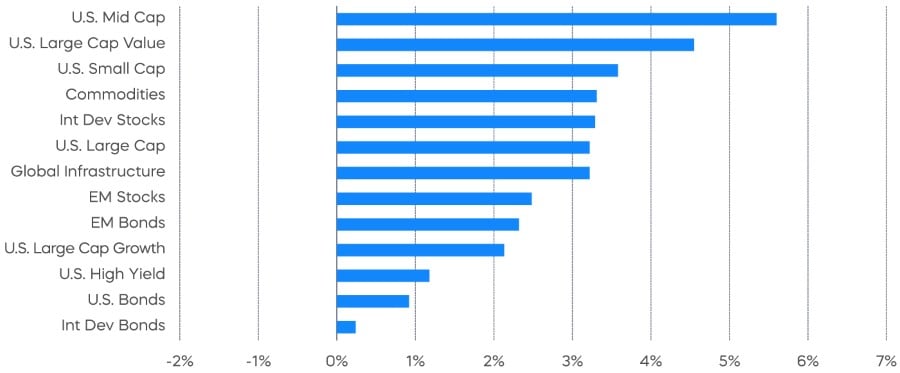
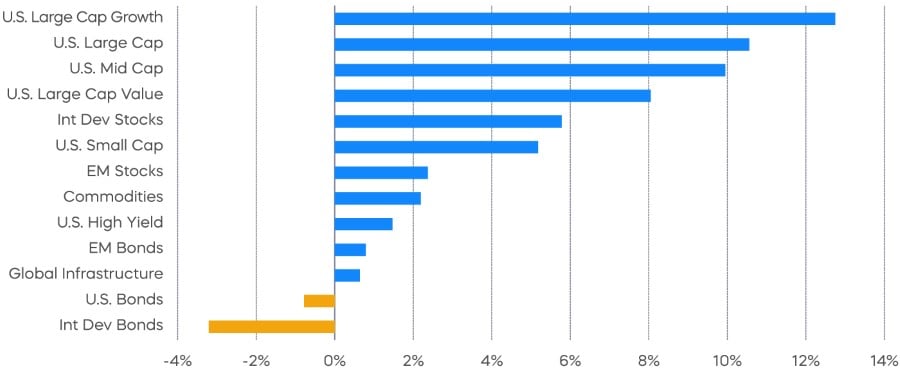
Performance Recap
Equity market breadth improved further in March, with mid-cap stocks and large-cap value stocks leading the gains. Dividend stocks also posted strong returns during the month. The S&P 500 equal-weighted index was up 4.5% in March, outperforming the market-cap-weighted S&P 500.
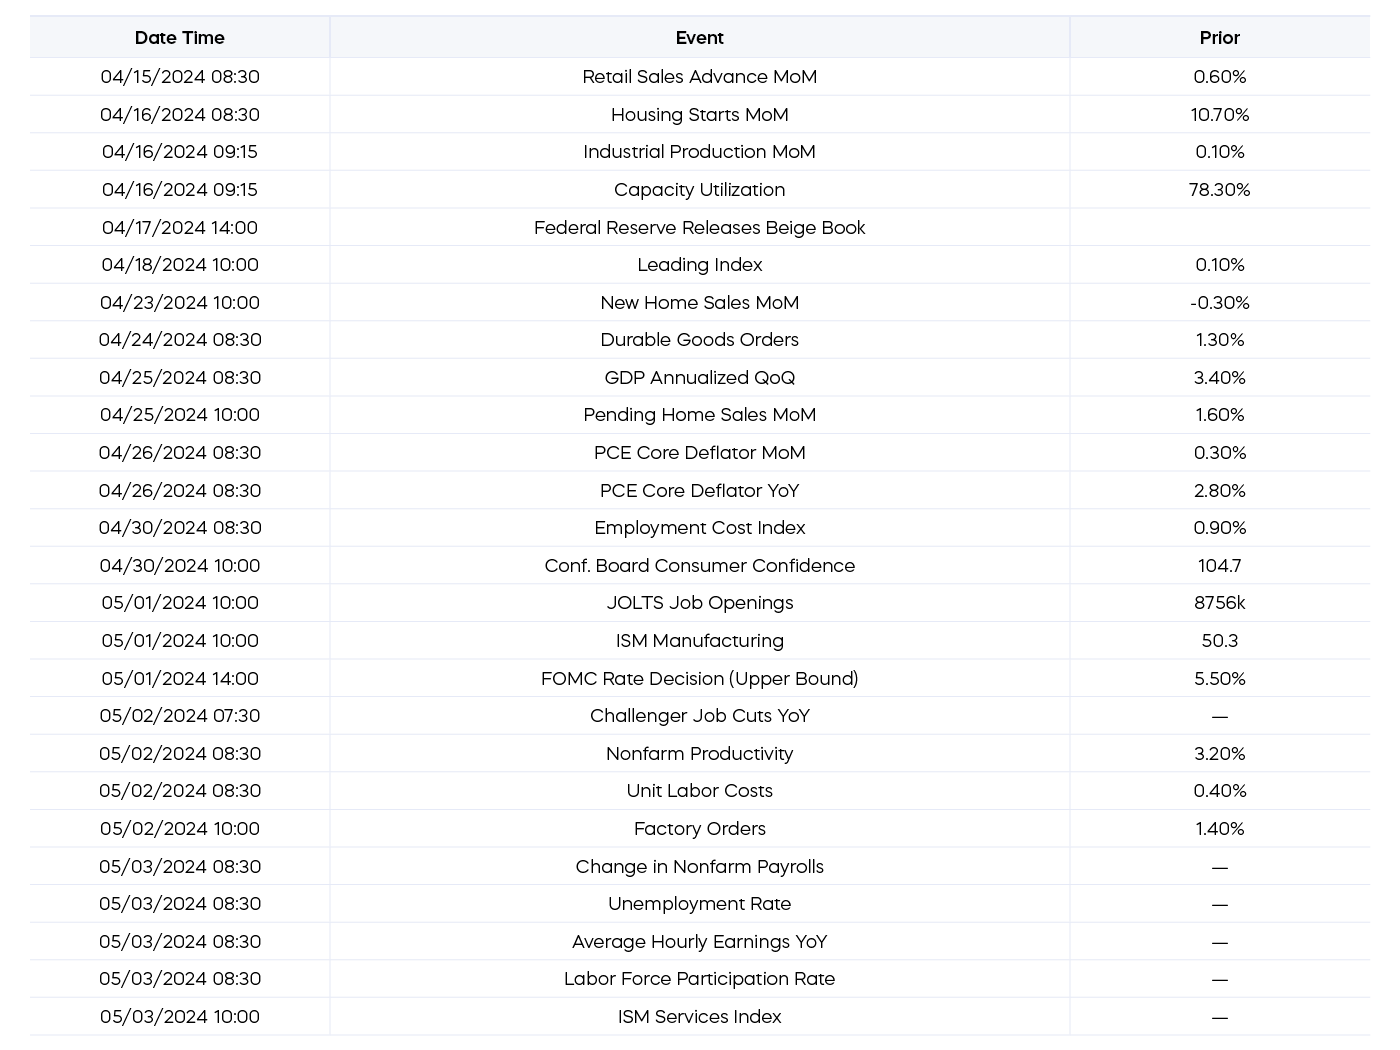
Economic Calendar
Here’s a list of key and upcoming economic releases, which can serve as a guide to potential market indicators.
Equity Perspectives

A notable economic indicator changed direction during March, potentially signaling a change for the direction of the economy and those still fearing recession. The latest reading of the Leading Economic Index (“LEI”), which provides an early indication of significant turning points in the business cycle and the direction of the economy over the near term, suddenly turned positive (barely) after 23 consecutive months of declines. Prior periods of extended declines in the LEI were usually associated with recessions. While we won’t declare the “all-clear” sign for the economy or markets, we’ll take the potential good news.
We’ll also note that March brought some potential green shoots for previously underperforming segments of the market, namely large-cap and mid-cap dividend growth strategies. According to Morningstar, after delivering solid 8.5% returns during 2023, the S&P 500 Dividend Aristocrats Index underperformed the top-heavy S&P 500 during last year’s rally. During March, the Aristocrats delivered 4.7% returns, ahead of the S&P 500’s 3.2%. And the S&P 400 MidCap Dividend Aristocrats Index did even better, delivering 5.9%. It was no coincidence this relative change happened as at least some of the Magnificent-7 leadership begins to fade.
The Daily Covered Call Opportunity
Covered call writing—an option strategy that investors have been deploying for decades—appears to be having a moment. Investors have shown a growing appetite for strategies that can potentially provide high levels of income with some equity market participation. An increasing number of exchange traded funds are making access to this strategy easier.
Since the start of 2021, net flows to options-based ETFs have exceeded $60 billion, according to Morningstar. But traditional covered call strategies—those using monthly call options—typically require investors to make a costly tradeoff between the potential for high income and long-term total returns. Since its inception in 2002, the CBOE S&P 500 BuyWrite Index has delivered less than half of the total returns of the S&P 500.
Recent innovations in the options market offer a potential solution. When the Chicago Board Options Exchange (“CBOE”) offered the first options contracts in 1973, they expired on a quarterly basis. Over time, monthly options contracts were introduced, and their popularity formed the basis for most covered call strategies used today. In 2016, the CBOE began offering options that expired each week on Wednesdays. By 2022, the CBOE offered weekly options expiring every day of the week, enabling what is now known as a daily covered call strategy.
Investors may benefit from a daily options strategy by both potentially generating high levels of income and participating more fully in upward price movements—possibly capturing returns that monthly strategies can miss.
A daily covered call strategy seeks to overcome the limitations of monthly call-writing strategies by selling call options each day, rather than once per month. This allows the opportunity to more fully participate in asset appreciation up to the strike price, which is effectively reset each day.
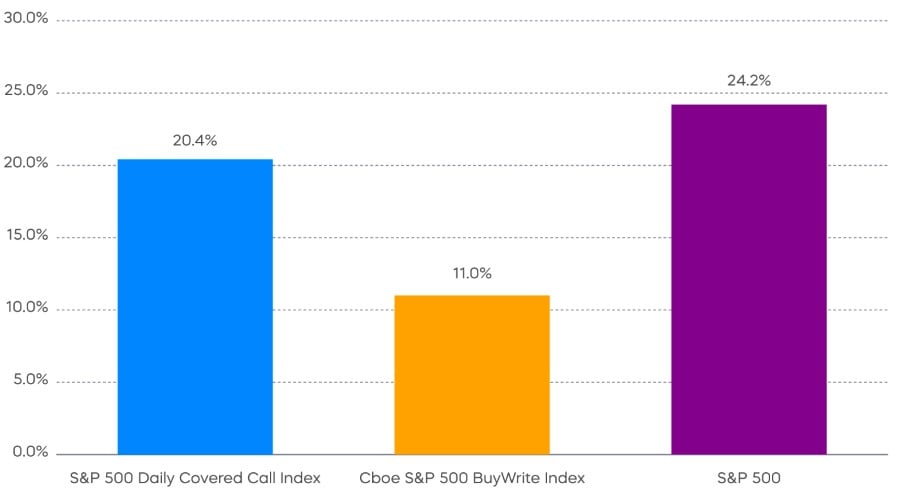
As we saw during the current market rally that started in October 2022, monthly call writing strategies can forgo significant appreciation potential in strong markets (Source: Bloomberg, as of 3/31/24). While daily covered call strategies are relatively new, the early results are compelling. Since its inception in October 2023, the S&P 500 Daily Covered Call Index has delivered substantially all of the total returns of the S&P 500, and almost double the returns of the monthly strategy, as represented in the chart below by the CBOE S&P 500 BuyWrite Index.
In addition to S&P 500 exposure, a daily call writing options strategy is now available on the Nasdaq-100 Index. The Nasdaq-100 Daily Covered Index was introduced earlier this month and consists of a long position in the Nasdaq-100 Total Return Index, with daily calls being written out-of-the-money using a disciplined rules-based approach.
Fixed Income Perspectives

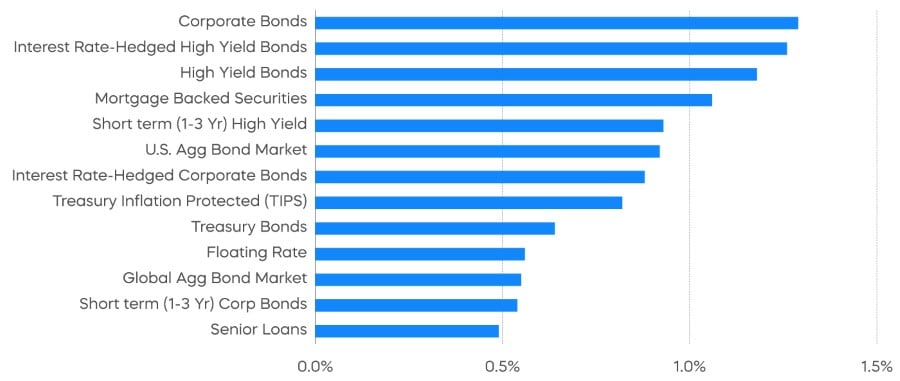
Long-term interest rates were range bound during March as interest rate volatility declined moderately. Credit spreads tightened slightly, contributing to an overall positive month for fixed income returns. Year-to-date, the top performing asset classes have been interest rate-hedged corporate bonds and floating rate loans.
Fixed Income Returns—March 2024
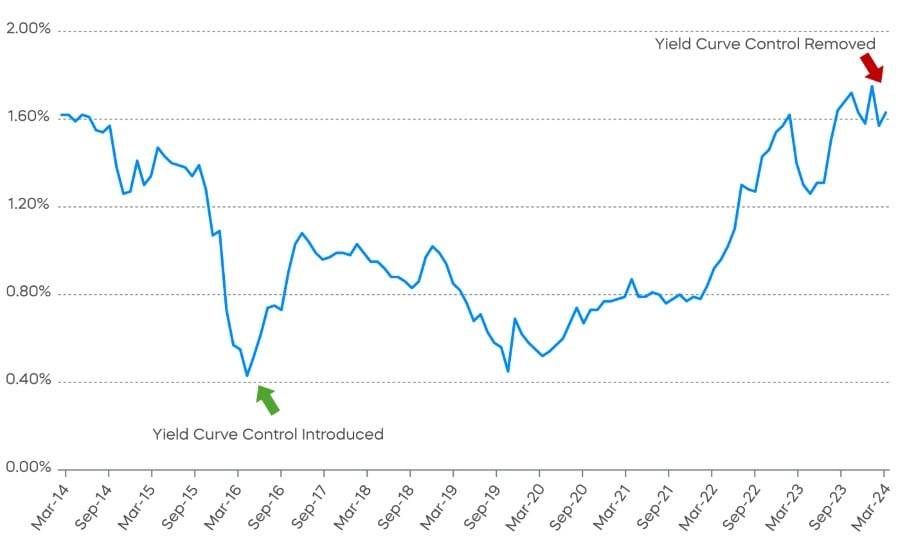
On March 19, the Bank of Japan lifted the overnight policy rate from -0.1% to around 0% to 0.1%, ending nearly a decade of negative interest rates in Japan. In addition, the Bank of Japan also removed Yield Curve Control, which has kept yields on the 10-year Japanese Government Bond (“JGB”) in a band since 2016.
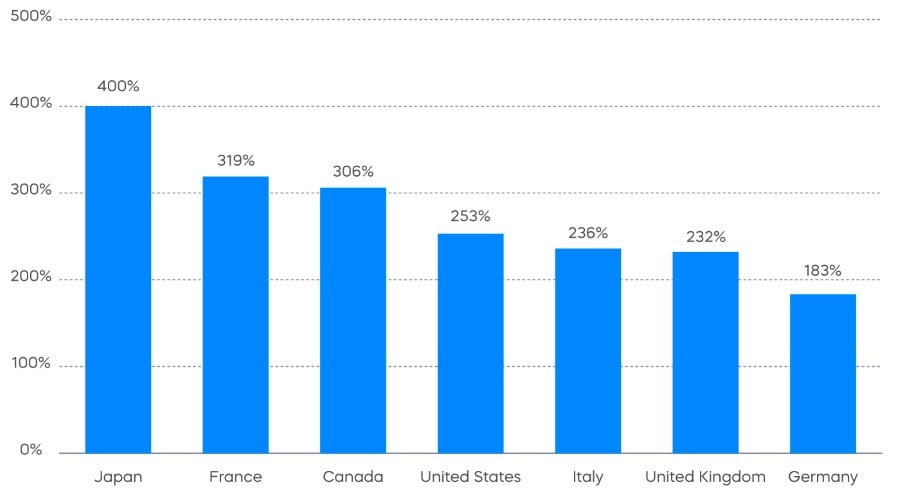
Japan has the highest amount of debt to service among the G7 countries. As such, policy shifts in Japan hold a symbolic significance to fixed income investors outside of Japan. As interest rates across developed economies tend to be correlated, many investors wonder if long-term interest rates will freely trade higher without manipulation from central banks. While these decisions by the Bank of Japan mark the end of an era, we don’t necessarily expect them to propel global interest rates higher.
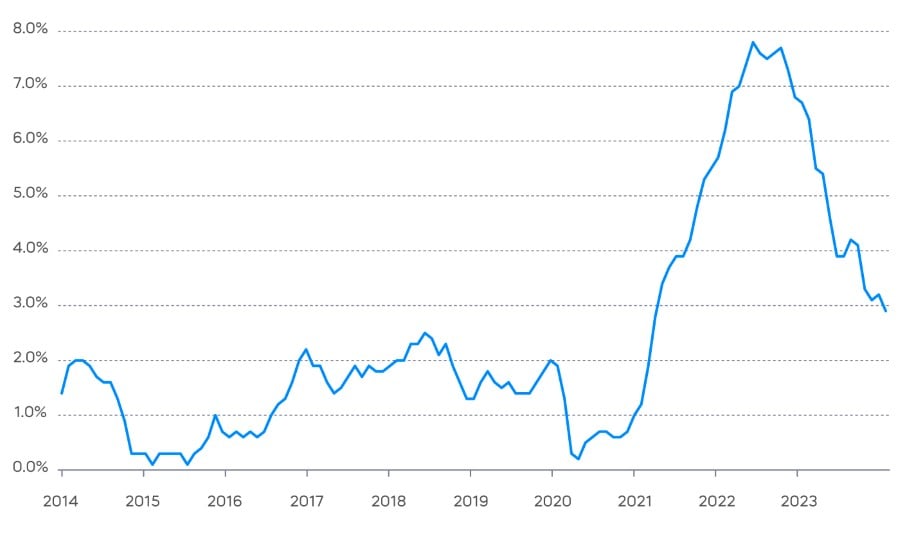
While a post-pandemic spike in inflation helped Japan break free from its decades-long deflationary mindset, inflation has already declined significantly in the rest of the world, as global central banks tightened monetary policy and pandemic-related factors receded. The Organisation for Economic Co-operation and Development’s (“OECD”) consumer price index for G7 countries has dropped below 3% on a year-over-year basis (as of January 2024), from a peak of nearly 8% in 2022. Even inflation in Japan has been rolling over as pass-through effects from prior rise in import prices moderate.
Amid easing inflationary pressures, some global central banks have started to cut interest rates or have signaled reductions in the near term. For a U.S. investor, the yield on a 10-year JGB with the currency risk hedged using 3-month FX forwards has averaged 6.5% this year.[1] With attractive yields and less uncertainty around the exit from negative interest rates, flows into Japanese bond markets have the potential to rise.
Part of the reason flows could resume is the market has already been pricing in the end of Yield Curve Control, which is indicated by the steepness of the JGB yield curve. The yield on a 30-year JGB is now 1.6% higher than the yield on a 2-year JGB, which is close to the overnight policy rate (Source: Bloomberg). This could explain the muted reactions in long-dated JGBs following the Bank of Japan announcement.
On the other hand, Bank of Japan Governor Ueda emphasized its cautious approach, likely keeping monetary conditions accommodative for longer. This draws parallel to the introduction of Yield Curve Control in September 2016, when the yen was strengthening and JGB was rallying leading up to the decision, causing a dilemma for the Bank of Japan at the time. With Yield Curve Control, the Bank of Japan affirmed policy easing for the long run, without committing to any immediate actions. This released pressures on JGBs in the short run, which pulled back from their rally while allowing the yen to weaken gradually from the long-run impact of the policy framework. Interestingly, the introduction of Yield Curve Control in 2016 coincided with the flattest JGB yield curve in recent years. If history were any guide, a successful exit from Yield Curve Control may still keep monetary policy accommodative in the short run, such that interest rates in Japan may remain lower.
Sources for data and statistics: Bloomberg, FactSet, Morningstar, and ProShares.
[1] Source: Bloomberg. An FX forward is a derivative contract to exchange a pair of currencies at a set rate on a future date. FX forwards are commonly used to obtain an exposure to a foreign currency or to offset an existing currency exposure.
The different market segments represented in the performance recap charts use the following indexes: U.S. Large Cap: S&P 500 TR; U.S. Large Cap Growth: S&P 500 Growth TR; U.S. Large Cap Value: S&P 500 Value TR; U.S. Mid Cap: S&P Mid Cap TR; U.S. Small Cap: Russell 2000 TR; International Developed Stocks: MSCI Daily TR NET EAFE; Emerging Markets Stocks: MSCI Daily TR Net Emerging Markets; Global Infrastructure: Dow Jones Brookfield Global Infrastructure Composite; Commodities: Bloomberg Commodity TR; U.S. Bonds: Bloomberg U.S. Aggregate; U.S. High Yield: Bloomberg Corporate High Yield; International Developed Bonds: Bloomberg Global Agg ex-USD; Emerging Market Bonds: DBIQ Emerging Markets USD Liquid Balanced.
The different market segments represented in the fixed income returns charts use the following indexes: Global Agg Bond Market: Bloomberg Global-Aggregate Total Return Index Value Unhedged USD; Mortgage Backed Securities: Bloomberg U.S. MBS Index Total Return Value Unhedged USD; Treasury Bonds: Bloomberg U.S. Treasury Total Return Unhedged USD; U.S. Agg Bond Market: Bloomberg U.S. Agg Total Return Value Unhedged USD; Corporate Bonds: Bloomberg US Corporate Total Return Value Unhedged USD; High Yield Bonds: Bloomberg U.S. Corporate High Yield Total Return Index Value Unhedged USD; Interest Rate-Hedged High Yield Bonds: FTSE High Yield (Treasury Rate-Hedged) Index; Treasury Inflation Protected (TIPS): Bloomberg U.S. Treasury Inflation Notes TR Index Value Unhedged USD; Short term (1-3 Yr) High Yield: Bloomberg U.S. Corporate 0-3 Year Total Return Index Value Unhedged USD; Senior Loans: Morningstar LSTA U.S. Leveraged Loan 100 Index; Short term (1-3 Yr) Corp Bonds: Bloomberg U.S. Corporate 1-3 Yr Total Return Index Value Unhedged USD; Floating Rate: Bloomberg U.S. FRN < 5 yrs Total Return Index Value Unhedged USD; Interest Rate-Hedged Corporate Bonds: FTSE Corporate Investment Grade (Treasury Rate-Hedged) Index.
The S&P 500 is a benchmark index published by Standard & Poor's (S&P) representing 500 companies with large-cap market capitalizations. The S&P 500 Dividend Aristocrats Index targets companies that are currently members of the S&P 500 that have increased dividend payments each year for at least 25 years. The S&P 400 MidCap Dividend Aristocrats Index targets companies that are currently members of the S&P MidCap 400 that have increased dividend payments each year for at least 15 years. The CBOE S&P 500 BuyWrite Index is a benchmark designed to track the performance of a hypothetical buy-write strategy on the S&P 500. The S&P 500 Daily Covered Call Index seeks to measure the performance of a long position in the S&P 500 TR and a short position in a standard S&P 500 daily call option, and aims to reflect higher income generation and lower timing risk by using daily options as opposed to monthly options. The Nasdaq-100 Daily Covered Call Index tracks the performance of a covered call strategy that aims to generate income through periodic selling of upside participation using Nasdaq-100 Index call options, typically with 1 day to expiration. THESE ENTITIES AND THEIR AFFILIATES MAKE NO WARRANTIES AND BEAR NO LIABILITY WITH RESPECT TO PROSHARES.
This is not intended to be investment advice. Indexes are unmanaged, and one cannot invest directly in an index. Past performance does not guarantee future results.
Any forward-looking statements herein are based on expectations of ProShare Advisors LLC at this time. Whether or not actual results and developments will conform to ProShare Advisors LLC’s expectations and predictions, however, is subject to a number of risks and uncertainties, including general economic, market and business conditions; changes in laws or regulations or other actions made by governmental authorities or regulatory bodies; and other world economic and political developments. ProShare Advisors LLC undertakes no duty to update or revise any forward-looking statements, whether as a result of new information, future events or otherwise.
Investing involves risk, including the possible loss of principal. This information is not meant to be investment advice.
The “S&P 500®,” “S&P 500® Dividend Aristocrats® Index” and “S&P 500 Daily Covered Call Index” are products of S&P Dow Jones Indices LLC and its affiliates and have been licensed for use by ProShare Advisors LLC. "S&P®" is a registered trademark of Standard & Poor’s Financial Services LLC (“S&P”), and “Dow Jones®" is a registered trademark of Dow Jones Trademark Holdings LLC (“Dow Jones”) and they have been licensed for use by S&P Dow Jones Indices LLC and its affiliates. ProShares ETFs based on these indexes are not sponsored, endorsed, sold or promoted by these entities or their affiliates, and they make no representation regarding the advisability of investing in ProShares ETFs. THESE ENTITIES AND THEIR AFFILIATES MAKE NO WARRANTIES AND BEAR NO LIABILITY WITH RESPECT TO PROSHARES.