The Impact of Geopolitics, Importance of Quality Equities, and the Opposing Forces Affecting Bonds
KEY OBSERVATIONS
February was largely defined by Russia’s invasion of Ukraine. Our thoughts are with the people of Ukraine, and we hope that peaceful political solutions emerge soon. Understandably, war triggers an intense emotional response for many. As difficult as it may be confronting the investment challenges caused by major world events, it more often than not requires a distinctly nonemotional response. Geopolitical events have historically had short-lived impacts on financial markets.
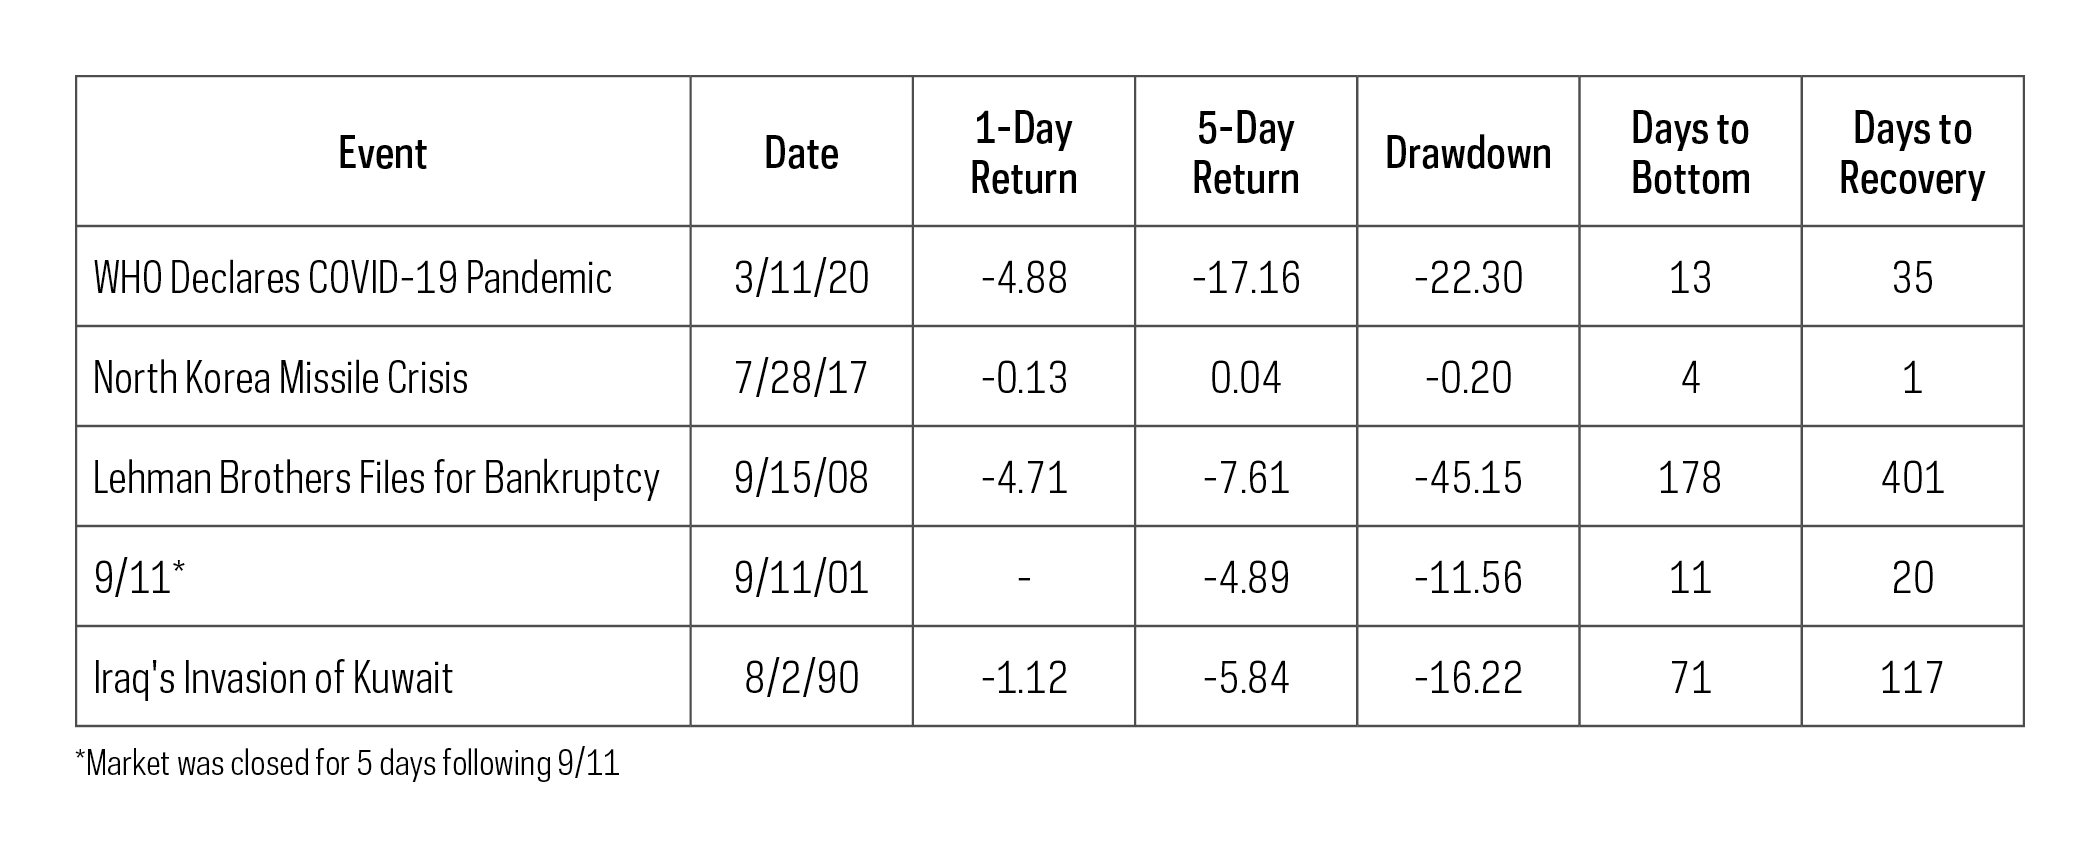
Drawdowns and subsequent recoveries have generally been measured in days or weeks, such as at the beginning of the pandemic or post 9/11, and confounded the timing of safe-haven trades. The speed of reversals also was not limited to the equity markets. The beginning of the pandemic saw investment grade credit spreads widen dramatically, but most of that move was reversed within a month. In just three months, those spreads were actually tighter.
The only event on this list with a longer-term impact was the Lehman Brothers bankruptcy. That event was a marker along the path of a deep and prolonged recession. Russia’s invasion of Ukraine, on the other hand, comes with a backdrop of a strong economy—a backdrop confirmed by the strong March 1 ISM Manufacturing report. The shorter-duration investment storms above may turn out to be reasonable guides.
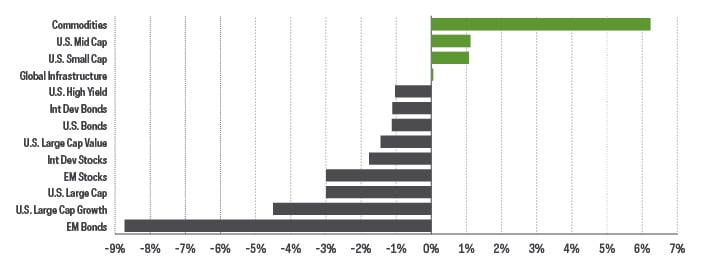
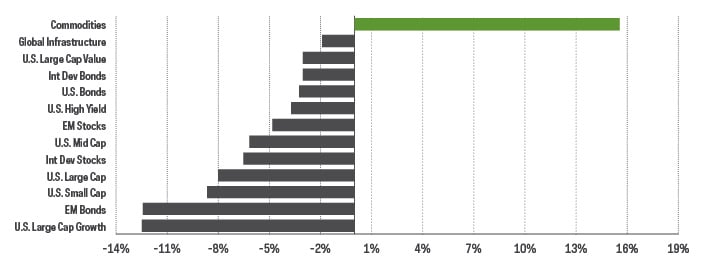
Performance Recap
EQUITY PERSPECTIVES
When Quality Really Matters
February marked another down month for most equity segments, with the S&P 500 declining roughly 3% after posting a 5% loss for January. While January’s weakness was commonly attributed to rising interest rates, geopolitical unrest has reintroduced itself as a risk factor that will likely remain with us for the near term. Markets have vacillated between strength and weakness, sometimes within the same trading day. Elevated volatility levels—the VIX reads 33 as of this writing (March 1) and is up from under 20 at the start of the year—confirms that investors are pricing in a wider set of potential risks and outcomes for the market. Even the stalwart 60% equity/40% bond allocation is down for the year, as bond prices are in the red.
Only time will tell if the S&P 500’s flirtations with an official correction will lead to deeper losses. Indeed, several segments of the market have already seen significant drawdowns and are firmly in bear market territory. In times like these, investors often seek out the relative safety of quality companies.
Quality comes in different varieties but may be defined by companies having attributes like solid fundamentals, stable earnings, and strong histories of profit and growth. Quality companies also typically have durable competitive advantages, which allow them to earn higher returns on their assets with lower levels of debt over time. Dividend growth strategies, like the S&P 500® Dividend Aristocrats®, embody this quality approach. The Dividend Aristocrats indexes are groups of companies, with versions across several different market-cap spectrums, that have sustained records of continuous dividend growth. Regardless of the macroeconomic circumstances, management at these elite firms reliably sends a powerful signal to the market, in the form of growing dividends, that they have confidence in their underlying business prospects. That they believe revenues and earnings will remain resilient, and that cash flow to support a growing dividend will continue. Over time, these strategies have outperformed by capturing most of the market’s upside, while losing less when markets decline.
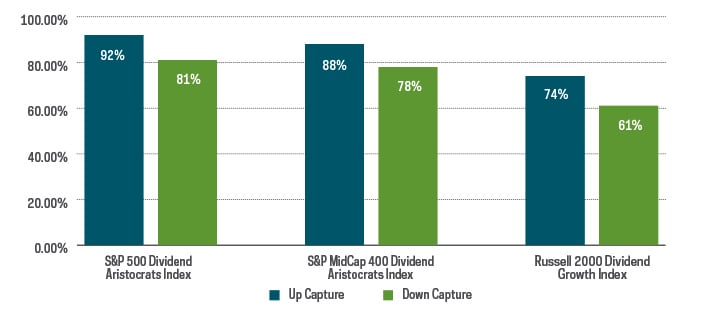
Thus far, year-to-date performance has been little different from long-term historical numbers shown in the chart above. Dividend growth strategies have generally provided a quality shelter in the storm for volatile markets. Through February, the large-cap S&P 500 Dividend Aristocrats Index has captured 82% of the S&P 500’s downside. Mid- and small-cap dividend growers have done even better. The S&P MidCap 400 Dividend Aristocrats Index has captured only 50% of the S&P MidCap 400’s losses, while the Russell 2000® Dividend Growth Index has captured only 39% of the Russell 2000 Index’s losses.
FIXED INCOME PERSPECTIVES
Opposing Forces Impact the Bond Market
While rising rates may have been to blame for January’s stock market performance, increased geopolitical tensions led to a continued downturn in February. However, these opposing forces have caused different reactions within the bond market.
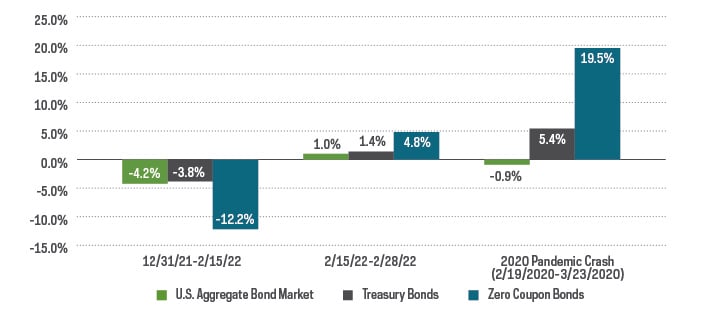
Russia’s invasion of Ukraine at the end of February and the resulting global sanctions put investors into a different kind of risk-off mode. The events pushed yields down, as investors began to search for safe-haven assets like Treasury bonds. That said, the overall reaction in the bond market has been fairly muted, with Treasurys up just 1% off recent midmonth lows, remaining in negative territory on both a month-to-date and year-to-date basis.
While recent geopolitical events are certainly concerning, the bond market doesn’t appear to be shouting just yet. With respect to zero coupon Treasury bonds, which often see optimal performance during periods of uncertainty, they are up just 4.8% off their recent lows.[1]
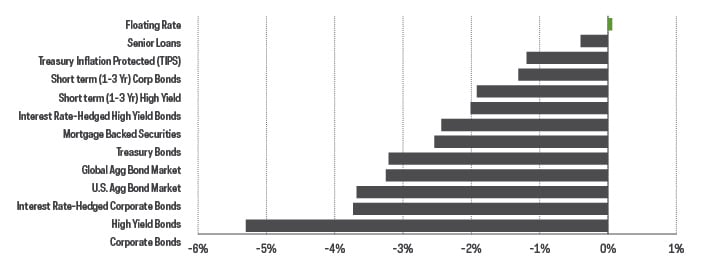
Month over month, the yield curve in fact shifted slightly upward in February. The economic recovery in the United States remains strong, and hopes are high that the pandemic will continue to subside. Geopolitical risks point out the use that safe haven assets can have in a diversified portfolio, especially in the short term. Our long-term view for a continued uptick in interest rates remains intact, however, and suggests a favorable outlook for shorter duration bond strategies. Recent events have also put pressure on credit risk, with investment grade credit spreads now at their widest since November 2020, indicating a potentially compelling opportunity if the markets begin to calm.
1. Zero coupon bond performance represented by the ICE BofA Long U.S. Treasury Principal STRIPS Index.
Sources for data and statistics: Bloomberg, Morningstar, and ProShares.
The different market segments represented in the performance recap charts use the following indexes: U.S. Large Cap: S&P 500 TR; U.S. Large Cap Growth: S&P 500 Growth TR; U.S. Large Cap Value: S&P 500 Value TR; U.S. Mid Cap: S&P Mid Cap TR; U.S. Small Cap: Russell 2000 TR; International Developed Stocks: MSCI Daily TR NET EAFE; Emerging Markets Stocks: MSCI Daily TR Net Emerging Markets; Global Infrastructure: Dow Jones Brookfield Global Infrastructure Composite; Commodities: Bloomberg Commodity TR; U.S. Bonds: Bloomberg U.S. Aggregate; U.S. High Yield: Bloomberg Corporate High Yield; International Developed Bonds: Bloomberg Global Agg ex-USD; Emerging Market Bonds: DBIQ Emerging Markets USD Liquid Balanced.
THESE ENTITIES AND THEIR AFFILIATES MAKE NO WARRANTIES AND BEAR NO LIABILITY WITH RESPECT TO PROSHARES.
This is not intended to be investment advice. Indexes are unmanaged, and one cannot invest directly in an index. Past performance does not guarantee future results.
Any forward-looking statements herein are based on expectations of ProShare Advisors LLC at this time. Whether or not actual results and developments will conform to ProShare Advisors LLC’s expectations and predictions, however, is subject to a number of risks and uncertainties, including general economic, market and business conditions; changes in laws or regulations or other actions made by governmental authorities or regulatory bodies; and other world economic and political developments. ProShare Advisors LLC undertakes no duty to update or revise any forward-looking statements, whether as a result of new information, future events or otherwise.
Investing is currently subject to additional risks and uncertainties related to COVID-19, including general economic, market and business conditions; changes in laws or regulations or other actions made by governmental authorities or regulatory bodies; and world economic and political developments.
Investing involves risk, including the possible loss of principal. This information is not meant to be investment advice.
Bonds will decrease in value as interest rates rise. International investments may also involve risks from geographic concentration, differences in valuation and valuation times, unfavorable fluctuations in currency, differences in generally accepted accounting principles, and economic or political instability. In emerging markets, many risks are heightened, and lower trading volumes may occur. Small- and mid-cap companies may lack the financial and personnel resources to handle economic or industry-wide setbacks, and, as a result, such setbacks could have a greater effect on small- and mid-cap security prices.
The “S&P 500® Dividend Aristocrats® Index” is a product of S&P Dow Jones Indices LLC and its affiliates and has been licensed for use by ProShares. “S&P®” is a registered trademark of Standard & Poor’s Financial Services LLC (“S&P”), and “Dow Jones®” is a registered trademark of Dow Jones Trademark Holdings LLC (“Dow Jones”) and they have been licensed for use by S&P Dow Jones Indices LLC and its affiliates. ProShares based on S&P indexes are not sponsored, endorsed, sold or promoted by S&P or their affiliates, and make no representation regarding the advisability of investing in ProShares. THIS ENTITY AND ITS AFFILIATES MAKE NO WARRANTIES AND BEAR NO LIABILITY WITH RESPECT TO PROSHARES.