Key Observations

November kicked off with the Federal Reserve unanimously deciding to keep the Fed Funds rate at 5.25–5.50%. Among the reasons for this “pause” from rate increases was the potential for higher longer-term interest rates to drag on economic growth and to reduce inflationary pressures.
Chair Powell made a subtle point in his comments that the Fed has been looking at longer-term interest rates to see if they are being driven by the anticipated path of the Fed Funds rate or whether they are behaving independently. Powell made it clear that the Fed sees longer-term rates behaving independently. This should come as no surprise. Quantitative Easing has ended, and longer-term interest rates should be driven by market forces reflecting longer-term inflation expectations and a “regular” real rate of interest.
Let’s start with the good news first: The 10-Year Breakeven inflation rate is now about 2.4%. That’s slightly above the Fed’s 2% target but certainly not indicative of a long-term inflationary spiral. 10-Year Treasury yields approaching 5% puts the real yield for the 10-Year Treasury notably above its long-term average of about 2%. That high real yield is almost certainly part of what the Fed sees as the tightening impact of higher long-term interest rates. It also suggests that longer-term rates may not head much higher.
Chart of the Month
2025 Consensus Forecasts (Bloomberg)
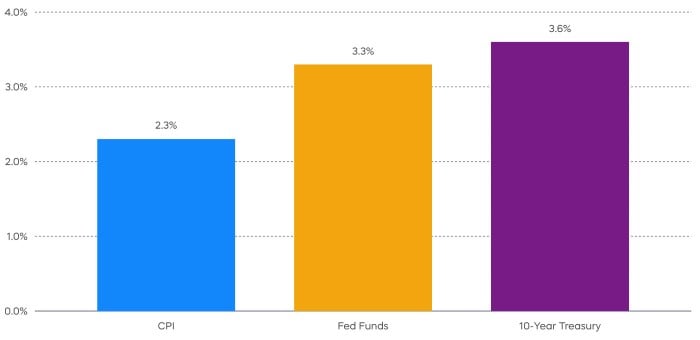
Source: Bloomberg, forecast as of 11/1/23.
Here’s the bad news: While another rate hike or two might not move longer-term interest rates higher, eventual cuts in the Fed Funds rate are unlikely to move longer-term interest rates lower.
The Chart of the Month shows a potential disconnect in consensus forecasts. Inflation at 2.3% and Fed Funds at 3.3% seem plausible a little more than a year from now. But, that 10-Year Treasury yield seems a bit low. Remember, the long-term average real yield has been 2%. That would suggest a 10-Year Treasury north of 4%—perhaps not too far removed from today’s level. And it’s that longer-term yield that can be a key driver of stock valuations.
This latest run-up in yields has been a key driver of declining stock prices. The worst of that pressure may be over, but don’t expect any boost to stocks when the Fed cuts, or looks like they will be cutting, the Fed Funds rate. Newly liberated longer-term rates might remain about where they are, and that should increase focus on earnings.
Performance Recap
Led by small-cap and mid-cap stock, risk-asset returns declined as Treasury yields rose during the month.
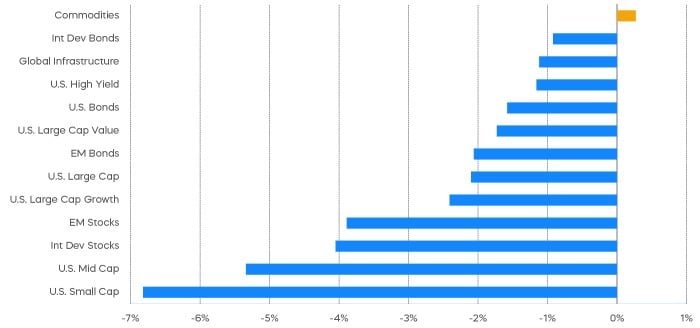
Asset Class Returns—October 2023
Asset Class Returns—Year to Date
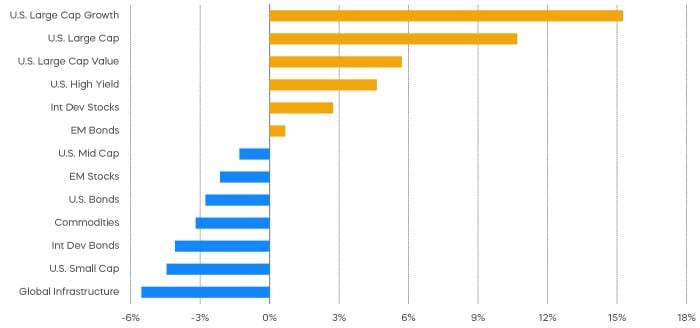
Source: Bloomberg. September returns 10/1/23‒10/31/23; year-to-date returns 1/1/23‒10/31/23. Index returns are for illustrative purposes only and do not reflect any management fees, transaction costs or expenses. Indexes are unmanaged, and one cannot invest directly in an index. Past performance does not guarantee future results.
Economic Calendar
Here’s a list of key and upcoming economic releases, which can serve as a guide to potential market indicators.
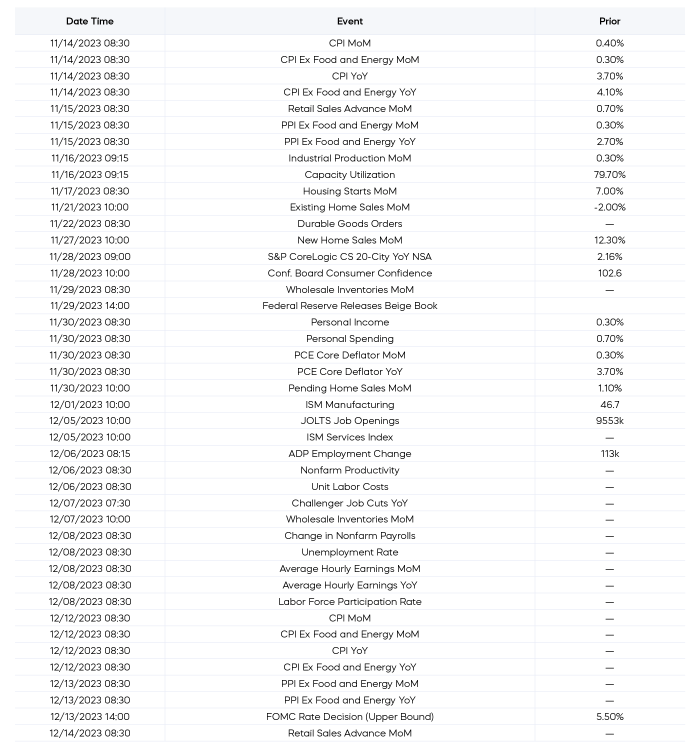
Source: Bloomberg, as of 11/2/23.
Equity Perspectives

Earnings On the Upswing
U.S. equity markets have been facing a variety of headwinds, most notably the relentless upward pressure on rates, escalating military conflicts abroad, and lingering recession fears. Questions regarding if, when, and what kind of economic recession we may or may not see remain open. One type of recession that has already arrived is of the earnings variety, but third-quarter results could indicate that recession is behind us and brighter days are ahead.
We are more than 60% through third-quarter earnings season, and expectations are that earnings will have increased by almost 3% over the prior year when the season concludes. While 3% can’t be described as robust, it will break three consecutive quarters of declines and set the stage for potential upside in 2024.
Another bit of positive news is the upward turn that earnings for technology stocks have taken. Tech stocks are sometimes viewed as a leading indicator, since technology is the largest and arguably most important sector in determining the overall direction of the markets. We noted previously that tech stocks increased their earnings during the second quarter, and with growth of 7% for the third quarter, they appear to be maintaining that momentum. 2024 could be even better. Not only are tech stocks forecast to produce the fastest revenue growth of any sector, they are also producing the highest profit margins of any sector (Source: FactSet, as of 10/31/23).
While we feel optimistic that earnings may have troughed, we believe it is important to focus on higher quality stocks like Dividend Aristocrats. Both the S&P 500 Dividend Aristocrats and the Technology Dividend Aristocrats have delivered more resilient earnings and trade at more attractive valuations than the broad market, making them potentially compelling investments (Source: FactSet, as of 10/31/23).
S&P 500 Earnings Growth
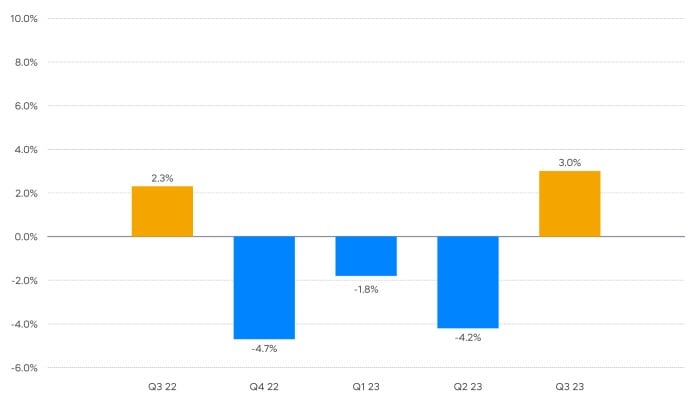
Source: FactSet. Data as of 11/1/2023.
S&P Composite 1500 Information Technology Index Earnings Growth
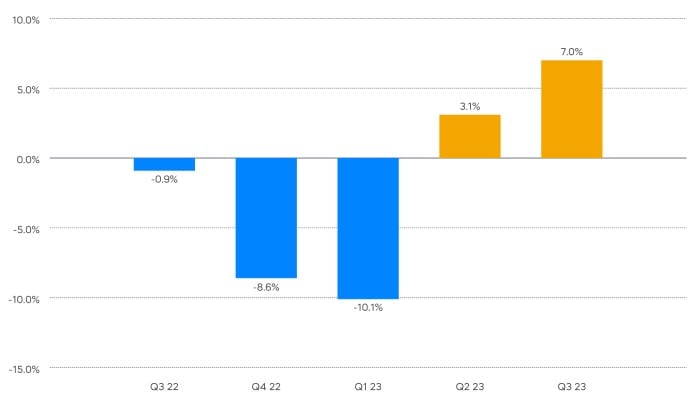
Source: FactSet. Data as of 11/1/2023.
Dividend Aristocrats Have Been Tough to Beat
Dividend strategies have struggled somewhat in 2023, during what has proven to be a difficult equity environment. While underperforming this year, evaluating dividend strategies with a longer-term perspective is critical. Since their inception in 2005, the S&P 500 Dividend Aristocrats Index has outperformed the S&P 500 with lower levels of volatility (Source: Morningstar, 5/2/05–10/31/23). That is a remarkable feat given that Standard & Poor’s latest SPIVA report (S&P Index versus Active) card shows that over 85% of large cap funds have underperformed the S&P 500 over the previous 10-year period.1
S&P thought it would be interesting to apply this comparison specifically to the dividend market and examine how the S&P 500 Dividend Aristocrats Index performed, versus actively managed U.S. equity income funds. It turns out that the Dividend Aristocrats has consistently beaten the vast majority of actively managed peers, including over 95% of funds in the recent 5- and 10-year periods. Tough times may not last, but the S&P 500 Dividend Aristocrats Index performance record has endured over time.
Percent of U.S. Active Equity Income Funds Underperforming
the S&P 500 Dividend Aristocrats Index
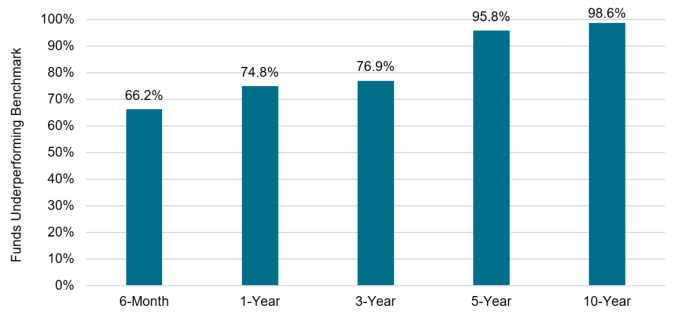
Source: S&P Dow Jones Indices LLC, CRSP database; U.S. active funds within the Equity Income Funds category. Data from 6/30/13–6/30/23. Chart is provided for illustrative purposes. Past performance is no guarantee of future results.
Fixed Income Perspectives

Longer duration bonds continued to underperform during October. Year-to-date, loans and interest rate hedged bonds have been leaders among fixed income assets.
Fixed Income Returns—October 2023
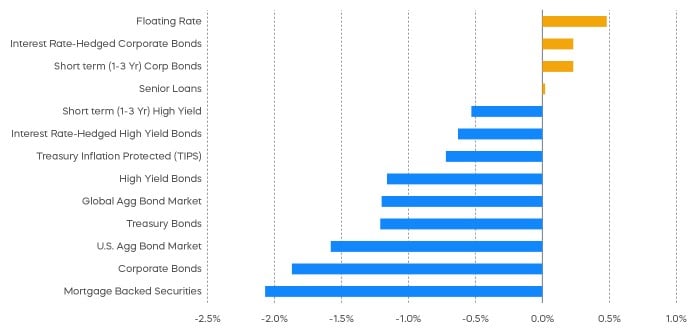
Source: Bloomberg. Data as of 10/31/23.
The Law of Supply and Demand
While advocates of Modern Monetary Theory might downplay the relevance of debt levels, recent surges in the fiscal deficit are drawing the market's attention. The U.S. Treasury is set to issue near-record levels of debt securities this year, with expectations for even more to come.
Net Issuance of Marketable U.S. Treasury Securities
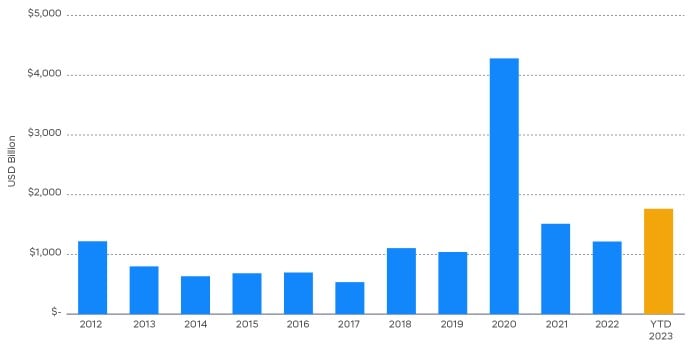
Source: SIFMA. Data as of 10/4/2023.
The law of supply and demand would normally suggest that if the supply outstrips demand, prices will fall. In practice, however, the impact on bond prices is confounded by the unpredictable behaviors of buyers and sellers.
On the demand front, higher interest rates and quantitative tightening have drained available reserves, which can typically absorb issuance in short-dated T-bills. These reserves parked at the central bank fall under the Federal Reserve’s liabilities, much like bank deposits. Over the past 12 months, they have shrunk by $1 trillion from their post-COVID peak. However, more than half of the reserves remains to provide for increases in the T-bill supply.
Federal Reserve Liabilities
Reverse Repo Agreement + Treasury General Account
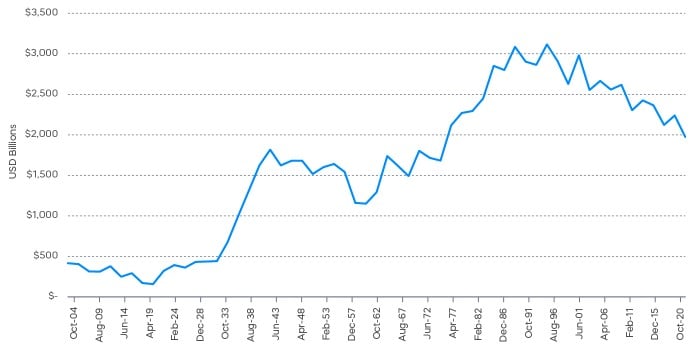
Source: Bloomberg monthly data. RRP balance as of 10/31/23 (daily). TGA balance as of 10/25/23 (weekly).
The outlook for long-term Treasury notes and bonds is similarly uncertain. With the Fed scaling back its balance sheet and banks cautious of rate risks, it falls to private sector investors to fill the gap.
Historically, foreign institutions, notably Japanese asset managers and insurers, have been significant buyers of long-term debt. Even as these investors pulled back in response to rate hikes in 2022, they have reemerged as buyers of international long-term debt, acquiring it at their fastest pace since yields fell into negative territory in Japan. Nevertheless, as global interest rates climb, the future of this foreign demand is unclear.
Net Purchase of International Long-Term Debt Securities by Designated Major Investors
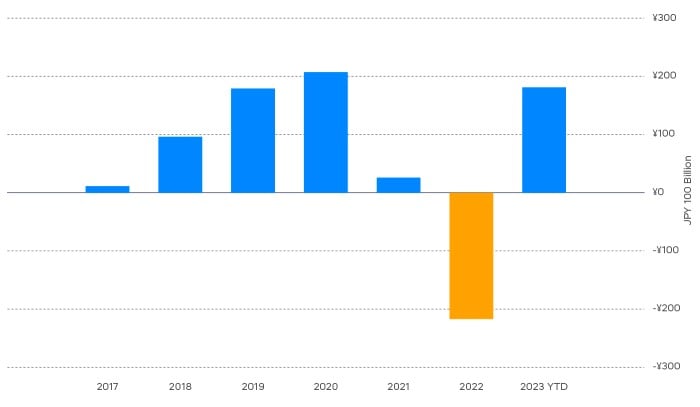
Source: Japan Ministry of Finance, data as of 10/10/23. Designated Major Investors indicate banks, financial instruments firms, insurance companies, and asset management companies, etc.
Theory holds that supply and demand eventually settles at an equilibrium price. For Treasury bonds, the long-term fiscal health of the United States should act as the primary factor in determining this balance. And while other factors influencing supply and demand may contribute to uncertainty, they should best be considered within a long-term context. This leads us to believe that supply and demand dynamics in the fixed income market will continue to be a important issue into the next year, potentially heightening interest rate volatility.
1 The SPIVA (S&P Index versus Active) reports from Standard and Poor’s compare the performance of active equity and fixed income mutual funds against their benchmarks over different time horizons.
Sources for data and statistics: Bloomberg, FactSet, Morningstar, and ProShares.
The different market segments represented in the performance recap charts use the following indexes: U.S. Large Cap: S&P 500 TR; U.S. Large Cap Growth: S&P 500 Growth TR; U.S. Large Cap Value: S&P 500 Value TR; U.S. Mid Cap: S&P Mid Cap TR; U.S. Small Cap: Russell 2000 TR; International Developed Stocks: MSCI Daily TR NET EAFE; Emerging Markets Stocks: MSCI Daily TR Net Emerging Markets; Global Infrastructure: Dow Jones Brookfield Global Infrastructure Composite; Commodities: Bloomberg Commodity TR; U.S. Bonds: Bloomberg U.S. Aggregate; U.S. High Yield: Bloomberg Corporate High Yield; International Developed Bonds: Bloomberg Global Agg ex-USD; Emerging Market Bonds: DBIQ Emerging Markets USD Liquid Balanced.
The S&P 500 is a benchmark index published by Standard & Poor's (S&P) representing 500 companies with large-cap market capitalizations. The S&P 500 Dividend Aristocrats Index targets companies that are currently members of the S&P 500 that have increased dividend payments each year for at least 25 years. The S&P Composite 1500 Information Technology comprises those companies included in the S&P Composite 1500 that are classified as members of the GICS Information Technology sector. THESE ENTITIES AND THEIR AFFILIATES MAKE NO WARRANTIES AND BEAR NO LIABILITY WITH RESPECT TO PROSHARES.
This is not intended to be investment advice. Indexes are unmanaged, and one cannot invest directly in an index. Past performance does not guarantee future results.
Any forward-looking statements herein are based on expectations of ProShare Advisors LLC at this time. Whether or not actual results and developments will conform to ProShare Advisors LLC’s expectations and predictions, however, is subject to a number of risks and uncertainties, including general economic, market and business conditions; changes in laws or regulations or other actions made by governmental authorities or regulatory bodies; and other world economic and political developments. ProShare Advisors LLC undertakes no duty to update or revise any forward-looking statements, whether as a result of new information, future events or otherwise.
Investing involves risk, including the possible loss of principal. This information is not meant to be investment advice.
The “S&P 500®” and “S&P 500® Dividend Aristocrats® Index” are products of S&P Dow Jones Indices LLC and its affiliates and have been licensed for use by ProShare Advisors LLC. "S&P®" is a registered trademark of Standard & Poor’s Financial Services LLC (“S&P”), and “Dow Jones®" is a registered trademark of Dow Jones Trademark Holdings LLC (“Dow Jones”) and they have been licensed for use by S&P Dow Jones Indices LLC and its affiliates. ProShares ETFs based on these indexes are not sponsored, endorsed, sold or promoted by these entities or their affiliates, and they make no representation regarding the advisability of investing in ProShares ETFs. THESE ENTITIES AND THEIR AFFILIATES MAKE NO WARRANTIES AND BEAR NO LIABILITY WITH RESPECT TO PROSHARES.