Key Observations

The reports came in hot in February. A month that began with just a 25 basis point increase in the Fed Funds rate and mildly dovish comments from Chair Powell ended up being filled with news challenging that narrative.
- A blockbuster payroll report that came with a higher-than-expected increase in average hourly earnings raising the specter of the dreaded wage-price-spiral.
- A higher than expected Consumer Price Index (CPI), Producer Price Index (PPI) and Personal Consumption Expenditures (PCE) deflator.1
- Red hot retail sales that… well… were likely just leftover clearance sales.
- Rising interest rates across the curve and retreating stocks.
Some began to question whether the Fed could bring inflation back under control. Inflation can be driven by a shock like the pandemic driven supply problems—that’s where the now-cliched notion of “transitory inflation” came from. Sustained, longer-term inflation, on the other hand, is driven by a self-fulfilling prophecy of inflation expectations. If inflation expectations are contained, then inflation will eventually decline. The chart below shows what happened to inflation expectations in February.
Chart of the Month
Breakeven Inflation Expectations
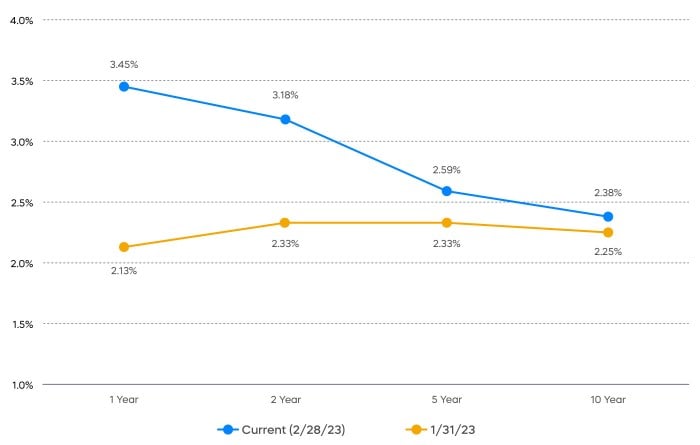
Source: Bloomberg. Data as of 2/28/2023
It’s neither a great picture, nor a terrible one. The arguably overly optimistic expectation that inflation would get close to the Fed’s target of 2% by next year has faded, but longer-term inflation expectations remained well-anchored.
Consider the implications for stocks. Stable longer-term inflation expectations suggest that valuation multiples like price-to-earnings (P/E), which shows how much investors are paying for a dollar of a company's earnings, are likely to remain stable. Stickier near-term inflation, however, points to earnings and margins at greater risk.
Case-in-point, the S&P 500 fell over 2% in February. While many point to inflation and interest rates driving lower multiples as the culprit, the deterioration of the Q4 earnings season that occurred in February could be more to blame. At the beginning of February, midway through the season, S&P 500 earnings had come in roughly flat. By the end of February, however, the season wrapped up with declines of over 2%.
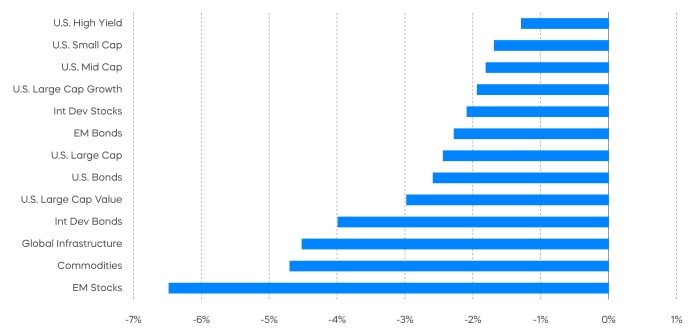
Performance Recap
Markets were red across the board in February, but remained predominantly green year to date.
Asset Class Returns—February 2023
Asset Class Returns—Year-to-Date 2023
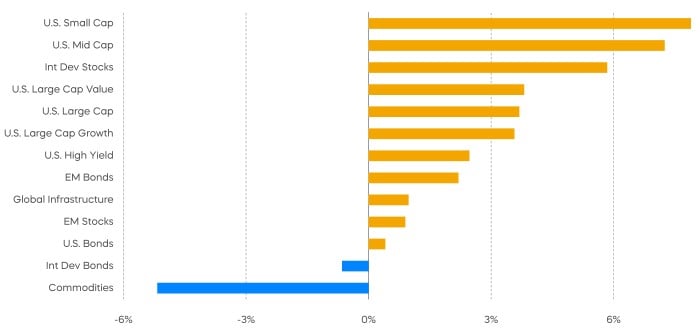
Source: Bloomberg. February returns 2/1/23‒2/28/23; year-to-date returns 1/1/23‒2/28/22. Past performance does not guarantee future results. Indexes are unmanaged, and one cannot invest directly in an index.
Economic Calendar
Here’s a list of upcoming key economic releases, which can serve as a guide to potential market indicators.
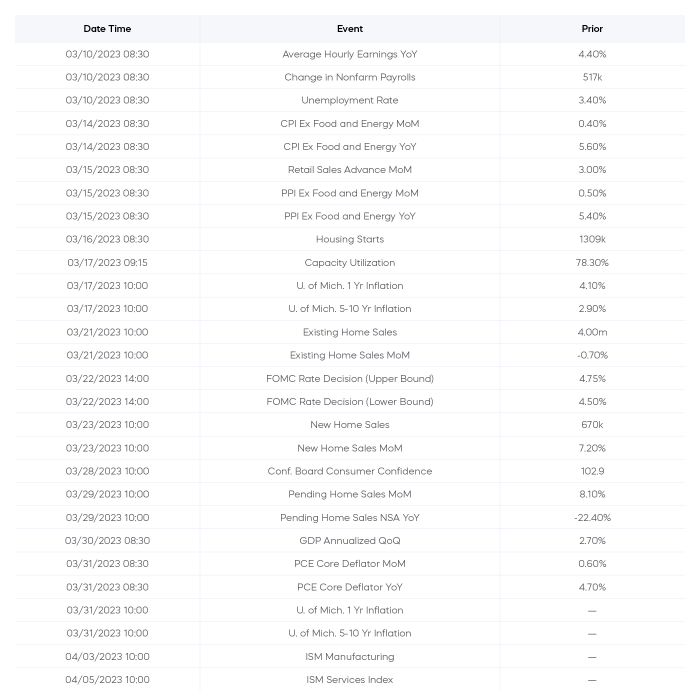
Source: Bloomberg, as of 3/1/23.
Equity Perspectives
After January’s buoyant rally, equity markets grappled with stronger-than-expected economic readings in February, ending the month with small losses. In what seems like it could be a recurring theme for the near-term, the market is struggling for direction. With risk-free yields moving higher, we think equity investors will remain cautious and higher-quality dividend growth stocks will remain attractive—even in unexpected segments.
Meet Me in the Middle
Mid-cap stocks don’t receive much fanfare and are often overlooked by investors. Frankly, that’s been a mistake. The foundational case for carving out an allocation to mid-cap stocks is compelling.
- Since Standard & Poor’s introduced the MidCap 400 in 1991, they have outperformed large caps and small caps on both a nominal and risk-adjusted basis.
- They’ve also outperformed on a consistent basis, having bested large caps over 83% of all rolling 10-year periods since 1991. Patient investors with a 10-year horizon—admittedly long by today’s standards—have never lost money in mid-cap stocks.
- More recently, the S&P MidCap 400 has outperformed the large-cap S&P 500 over trailing year-to-date, one-year and three-year periods.
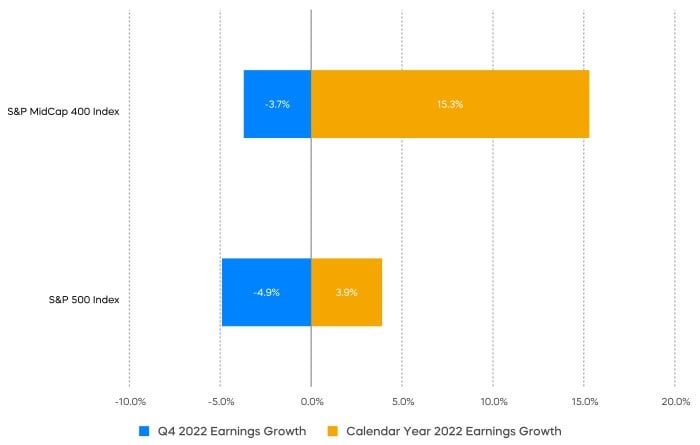
One explanation for mid-cap outperformance of late has been better fundamentals. With most of the attention on the S&P 500’s tepid results, mid caps have delivered. Despite weakness in Q4, 2022 earnings growth for the S&P MidCap 400 far exceeded that of large caps.
Of course, the market is forward-looking, and while 2022 results were impressive, 2023’s results are what really matter at this point. On that count, expectations are low, with analysts expecting little growth for large-cap stocks, and small year-over-year declines for mid caps. With the S&P 500 forward P/E ratio at near 18x, there is little room for error. (Forward price-to-earnings, or forward P/E, is a calculating of price-to-earnings (P/E) that uses forecasted earnings as a means of determining expectations for whether earnings will increase or decrease in the future.)
Mid Caps Have Delivered Better Earnings Growth
Source: FactSet. Data as of 2/28/2023. Past performance does not guarantee future results. Indexes are unmanaged, and one cannot invest directly in an index.
One group of stocks seemingly well positioned for the current environment is the S&P MidCap 400® Dividend Aristocrats®—a lineup of mid-cap companies that have raised their dividends for at least 15 consecutive years. Not only have these companies historically produced consistent earnings over time, they currently trade at only 15x forward earnings, offering a margin over large-cap stocks. (Source: FactSet, as of 3/1/23. Forward earnings are an estimate of a company's earnings for upcoming fiscal reporting periods.)
Fixed Income Perspectives
Rising Treasury yields put most fixed income segments in the red for the month of February. While corporate bond spreads widened moderately, fixed income segments with low or hedged interest rate exposures still posted positive returns.
Fixed Income Returns—February 2023
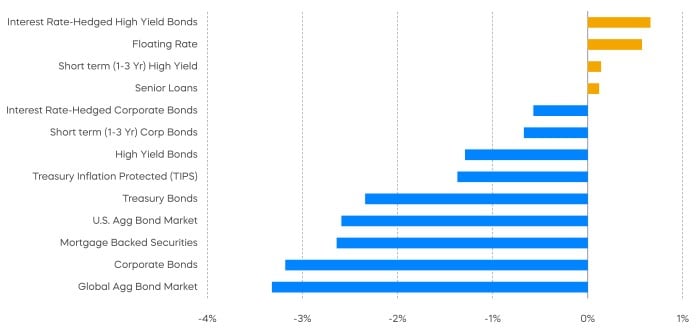
Source: Bloomberg, data from 2/1/23–2/28/23. Past performance does not guarantee future results. Indexes are unmanaged, and one cannot invest directly in an index.
Interest rates rose across the yield curve in February and the curve inverted further, raising recessionary alarm bells. The yield on the 2-year U.S. Treasury increased roughly 60 bps while the yield on the 10-year U.S. Treasury increased “only” 40 bps. As we noted in our chart-of-the-month, however, inflation expectations increased substantially as well.
Changes in Real Interest Rates
Change in 2 Year Change in 10 Year
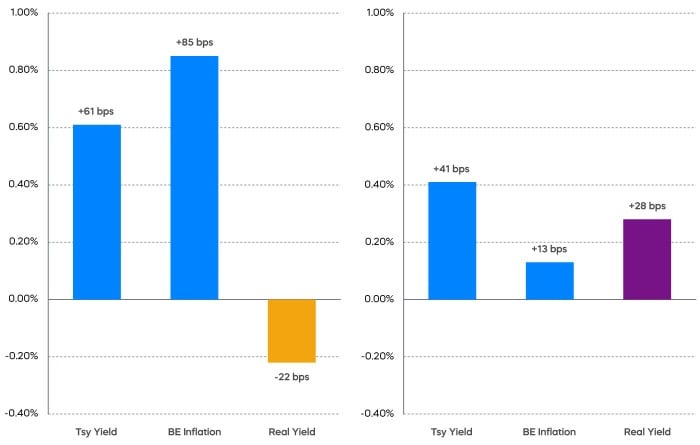
Source: Bloomberg. Data as of 2/28/23.
Inflation expectations rose more than the nominal yield on the 2-year U.S. Treasury, resulting in a decline in the real yield (the yield above expected inflation). In contrast, the 10-year U.S. Treasury yield rose substantially more than inflation expectations, resulting in a rise in the real yield.
Anchored long-term inflation expectations around 2% and long-term real yields around 2% represent a “normal,” “average,” “regular” world. Yes, indications in February were that the bond market might take a little longer to complete the inflation-mitigation fight. However, the bond market results did not indicate that the odds of a recession increased. In fact, one might argue, the bond market showed strengthening resolve towards a “normal” landing.
1 The Consumer Price Index (CPI) measures monthly changes in prices paid by consumers in the United States. The Producer Price Index (PPI) measures average price changes over time in the prices U.S. producers receive for their products. The Personal Consumption Expenditures (PCE), also known as consumer spending, measures peoples spending on goods and services in the United States. PCE must incorporate a deflator (the PCE deflator) and real values in order to determine the amount of periodic price change.
Sources for data and statistics: Bloomberg, FactSet, Morningstar, and ProShares.
The different market segments represented in the performance recap charts use the following indexes: U.S. Large Cap: S&P 500 TR; U.S. Large Cap Growth: S&P 500 Growth TR; U.S. Large Cap Value: S&P 500 Value TR; U.S. Mid Cap: S&P Mid Cap TR; U.S. Small Cap: Russell 2000 TR; International Developed Stocks: MSCI Daily TR NET EAFE; Emerging Markets Stocks: MSCI Daily TR Net Emerging Markets; Global Infrastructure: Dow Jones Brookfield Global Infrastructure Composite; Commodities: Bloomberg Commodity TR; U.S. Bonds: Bloomberg U.S. Aggregate; U.S. High Yield: Bloomberg Corporate High Yield; International Developed Bonds: Bloomberg Global Agg ex-USD; Emerging Market Bonds: DBIQ Emerging Markets USD Liquid Balanced.
The S&P 500 is a benchmark index published by Standard & Poor's (S&P) representing 500 companies with large-cap market capitalizations. The S&P MIdCap 400 is a benchmark index published by Standard & Poor's (S&P) representing 400 companies with mid-cap market capitalizations. The S&P MidCap 400 Dividend Aristocrats Index targets companies that are currently members of the S&P MidCap 400 that have increased dividend payments each year for at least 15 years. THESE ENTITIES AND THEIR AFFILIATES MAKE NO WARRANTIES AND BEAR NO LIABILITY WITH RESPECT TO PROSHARES.
This is not intended to be investment advice. Indexes are unmanaged, and one cannot invest directly in an index. Past performance does not guarantee future results.
Any forward-looking statements herein are based on expectations of ProShare Advisors LLC at this time. Whether or not actual results and developments will conform to ProShare Advisors LLC’s expectations and predictions, however, is subject to a number of risks and uncertainties, including general economic, market and business conditions; changes in laws or regulations or other actions made by governmental authorities or regulatory bodies; and other world economic and political developments. ProShare Advisors LLC undertakes no duty to update or revise any forward-looking statements, whether as a result of new information, future events or otherwise.
Investing is currently subject to additional risks and uncertainties related to COVID-19, including general economic, market and business conditions; changes in laws or regulations or other actions made by governmental authorities or regulatory bodies; and world economic and political developments.
Investing involves risk, including the possible loss of principal. This information is not meant to be investment advice.
The “S&P 500®,” “S&P MidCap 400®,” and “S&P MidCap 400® Dividend Aristocrats® Index” are products of S&P Dow Jones Indices LLC and its affiliates and have been licensed for use by ProShare Advisors LLC. "S&P®" is a registered trademark of Standard & Poor’s Financial Services LLC (“S&P”), and “Dow Jones®" is a registered trademark of Dow Jones Trademark Holdings LLC (“Dow Jones”) and they have been licensed for use by S&P Dow Jones Indices LLC and its affiliates. ProShares ETFs based on these indexes are not sponsored, endorsed, sold or promoted by these entities or their affiliates, and they make no representation regarding the advisability of investing in ProShares ETFs. THESE ENTITIES AND THEIR AFFILIATES MAKE NO WARRANTIES AND BEAR NO LIABILITY WITH RESPECT TO PROSHARES.